Workplace Safety
Data on this page
A. Global Lost-time Case Rate (per 100 Employees)

Cases with one or more days away from work per 200,000 hours
| 2005 | 2006 | 2007 | 2008 | 2009 | 2010 | |
|---|---|---|---|---|---|---|
| Ford Motor Company (global) | 1.5 | 1.1 | 0.9 | 0.7 | 0.6 | 0.5 |
| U.S. Bureau of Labor Statistics average for NAICS Code 3361 (motor vehicles manufacturing) | 1.9 | 1.8 | 1.8 | 1.8 | 1.3 | 1.3 |
- Related Links
Related Links
- In This Report:
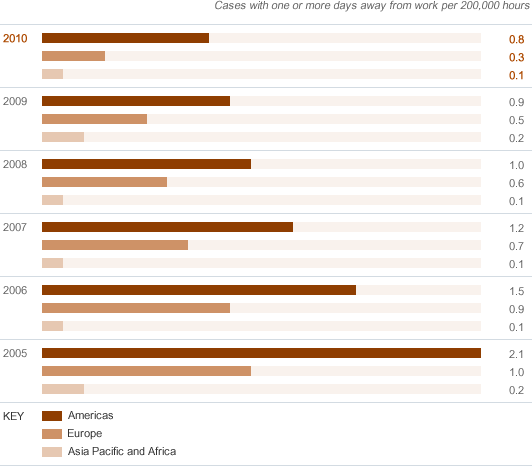
B. Lost-time Case Rate by Region (per 100 Employees)

Cases with one or more days away from work per 200,000 hours
| 2005 | 2006 | 2007 | 2008 | 2009 | 2010 | |
|---|---|---|---|---|---|---|
| Americas | 2.1 | 1.5 | 1.2 | 1.0 | 0.9 | 0.8 |
| Europe | 1.0 | 0.9 | 0.7 | 0.6 | 0.5 | 0.3 |
| Asia Pacific and Africa | 0.2 | 0.1 | 0.1 | 0.1 | 0.2 | 0.1 |
- Reported to regulatory authorities
Notes to Data
European data were amended for 2005.
Related Links
- In This Report:
C. Workplace Health and Safety Violations

Number of violations
| 2005 | 2006 | 2007 | 2008 | 2009 | 2010 | |
|---|---|---|---|---|---|---|
| Total | 8 | 1 | 9 | 7 | 0 | 1 |
| Americas | 8 | 1 | 9 | 7 | 0 | 1 |
| Europe | 0 | 0 | 0 | 0 | 0 | 0 |
| Asia Pacific/Africa | 0 | 0 | 0 | 0 | 0 | 0 |
- Related Links
Related Links
- In This Report:
D. Global Fatalities
- Related Links
Related Links
- In This Report:
- Overview
- Economy Data
- Environment Data
- Society Data

