Toolbox
Workplace Safety
Data On This Page
Note: In prior years, we reported our Global Severity Rate and Severity Rate by Region (both per 100 employees). We do not use these metrics to make business decisions, so we no longer track or report them.
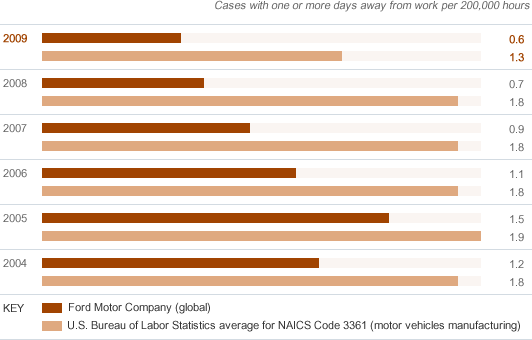
A. Global Lost-time Case Rate (per 100 Employees)

Cases with one or more days away from work per 200,000 hours
| 2004 | 2005 | 2006 | 2007 | 2008 | 2009 | |
|---|---|---|---|---|---|---|
| Ford Motor Company (global) | 1.2 | 1.5 | 1.1 | 0.9 | 0.7 | 0.6 |
| U.S. Bureau of Labor Statistics average for NAICS Code 3361 (motor vehicles manufacturing) | 1.8 | 1.9 | 1.8 | 1.8 | 1.8 | 1.3 |
In This Report:
B. Lost-time Case Rate by Region (per 100 Employees)

Cases with one or more days away from work per 200,000 hours
| 2004 | 2005 | 2006 | 2007 | 2008 | 2009 | |
|---|---|---|---|---|---|---|
| Americas | 1.7 | 2.1 | 1.5 | 1.2 | 1.0 | 0.9 |
| Europe | 0.7 | 1.0 | 0.9 | 0.7 | 0.6 | 0.5 |
| Asia Pacific and Africa | 0.3 | 0.2 | 0.1 | 0.1 | 0.1 | 0.2 |
European data were amended for 2005.
- Reported to regulatory authorities
In This Report:
C. Workplace Health and Safety Violations

Number of violations
| 2005 | 2006 | 2007 | 2008 | 2009 | |
|---|---|---|---|---|---|
| Total | 8 | 1 | 9 | 7 | 0 |
| Americas | 8 | 1 | 9 | 7 | 0 |
| Europe | 0 | 0 | 0 | 0 | 0 |
| Asia Pacific/Africa | 0 | 0 | 0 | 0 | 0 |
