Toolbox
Vehicle Safety
Data On This Page
- Percent of Nameplates Achieving 3-star or Better in Rollover NCAP
- Percent of Nameplates Achieving 4-star/4-star Frontal NCAP or Better
- Percent of Nameplates Achieving 5-star/5-star Frontal NCAP
- Percent of Nameplates Achieving 4-star/4-star or Better in LINCAP
- Percent of Nameplates Achieving 5-star/5-star or Better LINCAP
- IIHS Frontal Offset – Percent of Nameplates Achieving "Good" Rating
- Number of IIHS Top Safety Picks by Manufacturer
- Euro NCAP Results 2006–8
- U.S. Safety Recalls
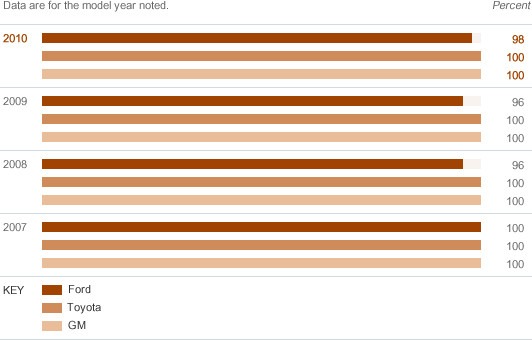
A. Percent of Nameplates Achieving 3-star or Better in Rollover NCAP
Data are for the model year noted.
| 2007 | 2008 | 2009 | 2010 | |
|---|---|---|---|---|
| Ford | 100 | 96 | 96 | 98 |
| Toyota | 100 | 100 | 100 | 100 |
| GM | 100 | 100 | 100 | 100 |
U.S. New Car Assessment Program
Read about the U.S. New Car Assessment Program.
Ford believes the NHTSA rollover resistance metric is flawed as it does not include a measure of the benefits of electronic stability control systems (ESC). NHTSA's studies have shown the benefits of ESC systems and their potential to improve vehicle stability. Ford believes ESC equipped vehicles should be credited in the resistance to rollover NCAP.
- Third party rated (NHTSA)
In This Report:
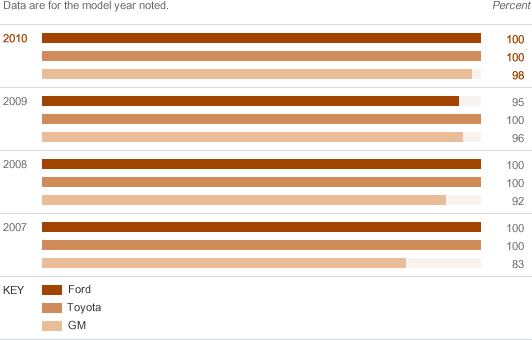
B. Percent of Nameplates Achieving 4-star/4-star Frontal NCAP or Better
Data are for the model year noted.
| 2007 | 2008 | 2009 | 2010 | |
|---|---|---|---|---|
| Ford | 100 | 100 | 95 | 100 |
| Toyota | 100 | 100 | 100 | 100 |
| GM | 83 | 92 | 96 | 98 |
U.S. New Car Assessment Program
- Third party rated (NHTSA)
In This Report:
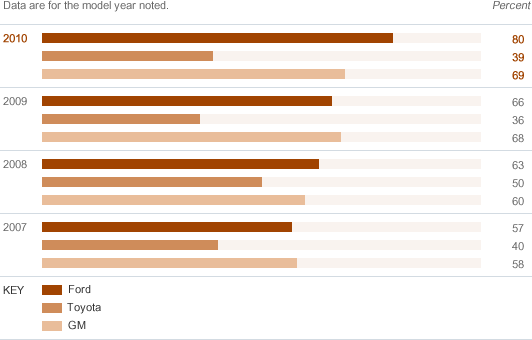
C. Percent of Nameplates Achieving 5-star/5-star Frontal NCAP
Data are for the model year noted.
| 2007 | 2008 | 2009 | 2010 | |
|---|---|---|---|---|
| Ford | 57 | 63 | 66 | 80 |
| Toyota | 40 | 50 | 36 | 39 |
| GM | 58 | 60 | 68 | 69 |
U.S. New Car Assessment Program
From the 2007 to 2010 model years, the percentage of Ford vehicles achieving 5-star/5-star ratings in frontal NCAP tests has increased by 40 percent. Improvements like this are driven in part by our internal Public Domain Guidelines, which are Ford guidelines that focus specifically on helping to ensure that our vehicles earn top marks in relevant public domain assessments.
- Third party rated (NHTSA)
In This Report:
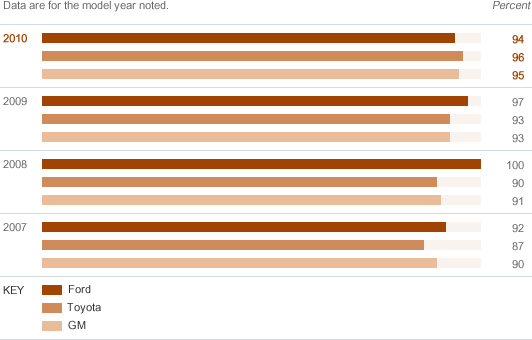
D. Percent of Nameplates Achieving 4-star/4-star or Better in LINCAP
Data are for the model year noted.
| 2007 | 2008 | 2009 | 2010 | |
|---|---|---|---|---|
| Ford | 92 | 100 | 97 | 94 |
| Toyota | 87 | 90 | 93 | 96 |
| GM | 90 | 91 | 93 | 95 |
U.S. New Car Assessment Program
- Third party rated (NHTSA)
In This Report:
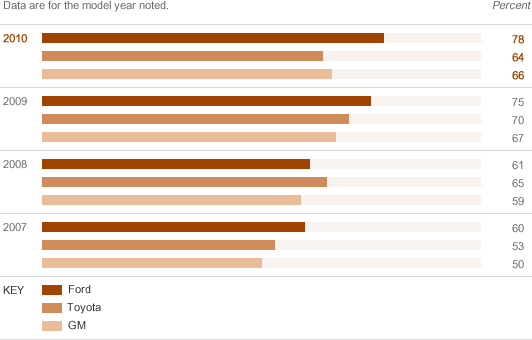
E. Percent of Nameplates Achieving 5-star/5-star or Better LINCAP
Data are for the model year noted.
| 2007 | 2008 | 2009 | 2010 | |
|---|---|---|---|---|
| Ford | 60 | 61 | 75 | 78 |
| Toyota | 53 | 65 | 70 | 64 |
| GM | 50 | 59 | 67 | 66 |
U.S. New Car Assessment Program
From the 2007 to 2010 model years, the percentage of Ford vehicles achieving 5-star/5-star or better ratings in the Lateral Impact New Car Assessment Program has increased by 30 percent. Improvements like this are driven in part by our internal Public Domain Guidelines, which are Ford guidelines that focus specifically on helping to ensure that our vehicles earn top marks in relevant public domain assessments.
- Third party rated (NHTSA)
In This Report:
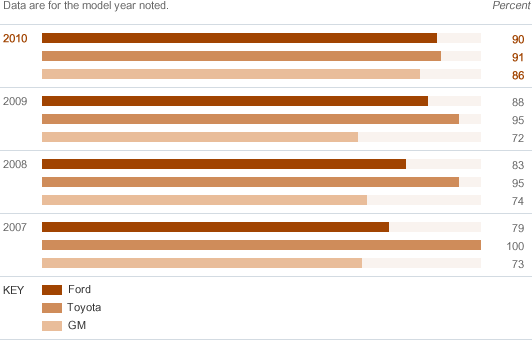
F. IIHS Frontal Offset – Percent of Nameplates Achieving "Good" Rating
Data are for the model year noted.
| 2007 | 2008 | 2009 | 2010 | |
|---|---|---|---|---|
| Ford | 79 | 83 | 88 | 90 |
| Toyota | 100 | 95 | 95 | 91 |
| GM | 73 | 74 | 72 | 86 |
In the 40 mph offset test of the Insurance Institute for Highway Safety (IIHS), 40 percent of the total width of a vehicle strikes a barrier on the driver's side. The forces in the test are similar to those involved in a frontal offset crash between two vehicles of the same weight, each going just less than 40 mph. Test results can be compared only among vehicles of similar weight. Like full-width crash test results, the results of offset tests cannot be used to compare vehicle performance across weight classes.
Based on a vehicle's performance in three areas evaluated in the frontal offset crash tested – structural performance, injury measures and restraints/dummy kinematics – the IIHS assigns a vehicle an overall crashworthiness measure of Good, Acceptable, Marginal or Poor. For more information, go to www.iihs.org.
- Third party rated (IIHS)
In This Report:
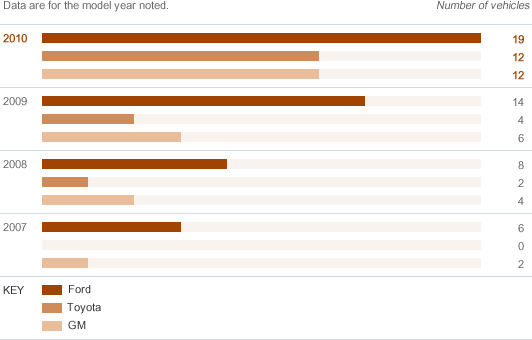
G. Number of IIHS Top Safety Picks by Manufacturer
Data are for the model year noted.
| 2007 | 2008 | 2009 | 2010 | |
|---|---|---|---|---|
| Ford | 6 | 8 | 14 | 19 |
| Toyota | 0 | 2 | 4 | 12 |
| GM | 2 | 4 | 6 | 12 |
To earn a Top Safety Pick from the Insurance Institute for Highway Safety (IIHS), a vehicle must receive a rating of "good" in offset frontal impact, side impact and rear impact evaluations, and offer electronic stability control. Top Safety Picks are the best vehicle choices for safety within size categories. 2005 (2006 Model Year) was the first year the IIHS issued Top Safety Picks. For 2010, vehicles will also be expected to earn a "good" rating in roof strength tests.
From the 2007 to 2010 model years, the percentage of Ford vehicles earning Top Safety Picks from the IIHS has increased by 217 percent. Improvements like this are driven in part by our internal Public Domain Guidelines, which are Ford guidelines that focus specifically on helping to ensure that our vehicles earn top marks in relevant public domain assessments.
- Third party rated (IIHS)
In This Report:
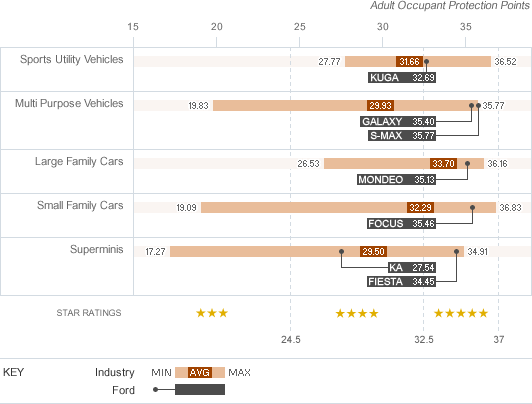
H. Euro NCAP Results 2006–8
| Industry Low | Industry High | Industry Average | Ford results | |
|---|---|---|---|---|
| Sports Utility Vehicles | 27.77 | 36.52 | 31.66 | Ford Kuga: 32.69 |
| Multi Purpose Vehicles | 19.93 | 35.77 | 29.93 | Ford Galaxy: 35.40, Ford S-MAX: 35.77 |
| Large Family Cars | 26.53 | 36.16 | 33.7 | Ford Mondeo: 35.13 |
| Small Family Cars | 19.09 | 36.83 | 32.29 | Ford Focus: 35.46 |
| Superminis | 17.27 | 34.91 | 29.50 | Ford Ka: 27.54, Ford Fiesta: 34.45 |
EuroNCAP has developed more-stringent requirements, which went into effect in 2009. However, EuroNCAP does not test all vehicles annually, so no Ford vehicles have yet been assessed under the new system. For the vehicles noted in the chart, "adult occupant" ratings range from 0 to 5 stars. 3 star = up to 24.5, 4 star = 24.5 to 32.5, 5 star = 32.5 and above; maximum = 37 points. For additional information, go to www.euroncap.com.
- Third party rated (Euro NCAP)
In This Report:
I. U.S. Safety Recalls
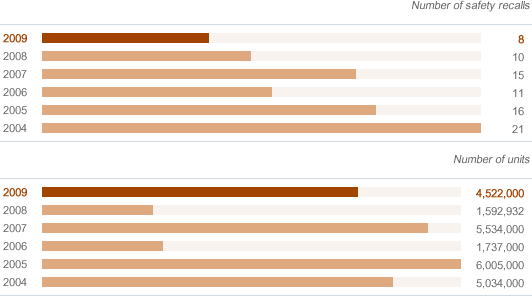
| 2004 | 2005 | 2006 | 2007 | 2008 | 2009 | |
|---|---|---|---|---|---|---|
| Number of safety recalls | 21 | 16 | 11 | 15 | 10 | 8 |
| Number of units | 5,034,000 | 6,005,000 | 1,737,000 | 5,534,000 | 1,592,932 | 4,522,000 |
Recalls are by calendar year rather than model year. A single recall may affect several vehicle lines and/or several model years. The same vehicle may have multiple recalls. (Source: U.S. National Highway Traffic Safety Administration.)
All but 12,000 of the 4.5 million vehicles recalled in 2009 are older models (1992–2003) that were equipped with faulty Texas Instruments speed control deactivation switches. Although the data shows the majority of the vehicles equipped with these switches do not pose a significant safety risk, we recalled them to reassure customers and eliminate any future concerns.
- Reported to regulatory authorities (NHTSA)
In This Report:
U.S. New Car Assessment Program
Government star ratings are part of the New Car Assessment Program (NCAP) of the U.S. National Highway Traffic Safety Administration (NHTSA). The NCAP rating system is in the process of being significantly altered. As such, fewer vehicles (of all makes) will receive top ratings in the future. Changes to the NCAP system were slated to apply to 2010 model year vehicles, but NHTSA delayed implementation and will now first apply the tougher requirements to 2011 model year vehicles. The following describes how the NCAP system has been applied to date.
In NHTSA's frontal crash rating tests, vehicles with belted front-seat test dummies are crashed into a fixed barrier at 35 mph, which is equivalent to a head-on collision between two similar vehicles, each moving at 35 mph. Since the test is designed to reflect a crash between two similar vehicles, one can meaningfully compare vehicles from the same weight class (within +/- 250 lbs) when looking at frontal crash test ratings.
Instruments measure the force of the impact to each test dummy's head, chest and legs. NHTSA uses the readings from these instruments to estimate the chance that a real occupant would sustain a serious injury in the tested frontal crash. A serious injury is defined as one that requires immediate hospitalization and may be life-threatening.
For side crash ratings, belted test dummies are placed in the driver seat and rear passenger seat (driver's side). The side crash rating is designed to represent an intersection-type collision with a 3,015 lb barrier moving at 38.5 mph into a standing vehicle. The moving barrier is covered with material that has "give" to replicate the front of a vehicle. Since all rated vehicles are impacted by the same size barrier, it is possible to compare all vehicles with each other when looking at side crash protection ratings. Instruments measure the force of impact to each dummy's head, neck, chest and pelvis. Side crash star ratings indicate the chance of a serious chest injury for the driver, front seat passenger and the rear seat passenger (first and second row occupants).
| What do the stars mean? | Chance of serious injury | |
|---|---|---|
| Frontal Crash Rating | Side Crash Rating | |
| 10 percent or less | 5 percent or less | |
| 11–20 percent | 6–10 percent | |
| 21–35 percent | 11–20 percent | |
| 36–45 percent | 21–25 percent | |
| 46 percent or greater | 26 percent or greater | |
For more information, go to www.nhtsa.dot.gov.