Data
Data on this page
- Percent of Nameplates Achieving 3-star or Better in Rollover NCAP
- Percent of Nameplates Achieving 4-star/4-star Frontal NCAP or Better
- Percent of Nameplates Achieving 5-star/5-star Frontal NCAP
- Percent of Nameplates Achieving 4-star/4-star or Better in LINCAP
- Percent of Nameplates Achieving 5-star/5-star or Better LINCAP
- IIHS Frontal Offset – Percent of Nameplates Achieving “Good” Rating
- Percent of Nameplates Achieving IIHS Top Safety Pick by Manufacturer
- U.S. Safety Recalls
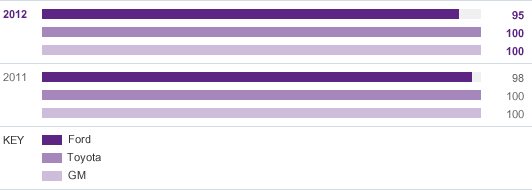
A. Percent of Nameplates Achieving 3-star or Better in Rollover NCAP
Data are for the model year noted.
Percent
| 2011 | 2012 | |
|---|---|---|
| Ford | 98 | 95 |
| Toyota | 100 | 100 |
| GM | 100 | 100 |
- Third party rated (NHTSA)
Notes to Data
The National Highway Traffic Safety Administration (NHTSA) has significantly changed its New Car Assessment Program (NCAP), such that the results for 2011 and 2012 model year vehicles cannot be accurately compared to previous model years. For example, NHTSA has added a “rigid pole impact test” to assess side-impact safety (in addition to an existing side-impact test); implemented the use of a smaller dummy in the passenger seat in frontal and side impact tests; and made significant changes to the injury criteria. For detailed information on the new NCAP system, see www.safercar.gov, and in particular http://www.safercar.gov/staticfiles/toolkit/pdfs/faq.pdf (pdf, 213kb).
Related Links
In This Report:
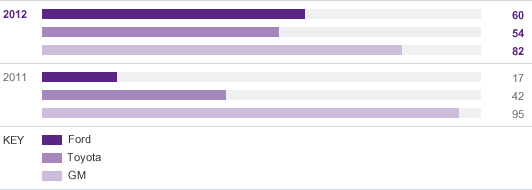
B. Percent of Nameplates Achieving 4-star/4-star Frontal NCAP or Better
Data are for the model year noted.
Percent
| 2011 | 2012 | |
|---|---|---|
| Ford | 17 | 60 |
| Toyota | 42 | 54 |
| GM | 95 | 82 |
- Third party rated (NHTSA)
Notes to Data
The National Highway Traffic Safety Administration (NHTSA) has significantly changed its New Car Assessment Program (NCAP), such that the results for 2011 and 2012 model year vehicles cannot be accurately compared to previous model years. For example, NHTSA has added a “rigid pole impact test” to assess side-impact safety (in addition to an existing side-impact test); implemented the use of a smaller dummy in the passenger seat in frontal and side impact tests; and made significant changes to the injury criteria. For detailed information on the new NCAP system, see www.safercar.gov, and in particular http://www.safercar.gov/staticfiles/toolkit/pdfs/faq.pdf (pdf, 213kb).
The data for the 2011MY NHTSA NCAP percentages were misstated in our last report. The corrected data are included in this graph.
Related Links
In This Report:
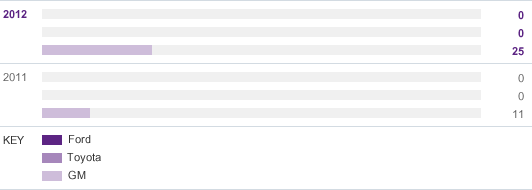
C. Percent of Nameplates Achieving 5-star/5-star Frontal NCAP
Data are for the model year noted.
Percent
| 2011 | 2012 | |
|---|---|---|
| Ford | 0 | 0 |
| Toyota | 0 | 0 |
| GM | 11 | 25 |
- Third party rated (NHTSA)
Notes to Data
The National Highway Traffic Safety Administration (NHTSA) has significantly changed its New Car Assessment Program (NCAP), such that the results for 2011 and 2012 model year vehicles cannot be accurately compared to previous model years. For example, NHTSA has added a “rigid pole impact test” to assess side-impact safety (in addition to an existing side-impact test); implemented the use of a smaller dummy in the passenger seat in frontal and side impact tests; and made significant changes to the injury criteria. For detailed information on the new NCAP system, see www.safercar.gov, and in particular http://www.safercar.gov/staticfiles/toolkit/pdfs/faq.pdf (pdf, 213kb).
The data for the 2011MY NHTSA NCAP percentages were misstated in our last report. The corrected data are included in this graph.
Related Links
In This Report:
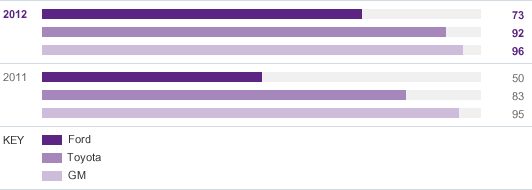
D. Percent of Nameplates Achieving 4-star/4-star or Better in LINCAP
Data are for the model year noted.
Percent
| 2011 | 2012 | |
|---|---|---|
| Ford | 50 | 73 |
| Toyota | 83 | 92 |
| GM | 95 | 96 |
- Third party rated (NHTSA)
Notes to Data
The National Highway Traffic Safety Administration (NHTSA) has significantly changed its New Car Assessment Program (NCAP), such that the results for 2011 and 2012 model year vehicles cannot be accurately compared to previous model years. For example, NHTSA has added a “rigid pole impact test” to assess side-impact safety (in addition to an existing side-impact test); implemented the use of a smaller dummy in the passenger seat in frontal and side impact tests; and made significant changes to the injury criteria. For detailed information on the new NCAP system, see www.safercar.gov, and in particular http://www.safercar.gov/staticfiles/toolkit/pdfs/faq.pdf (pdf, 213kb).
The data for the 2011MY NHTSA LINCAP percentages were misstated in our last report. The corrected data are included in this graph.
Related Links
In This Report:
E. Percent of Nameplates Achieving 5-star/5-star or Better LINCAP
Data are for the model year noted.
Percent
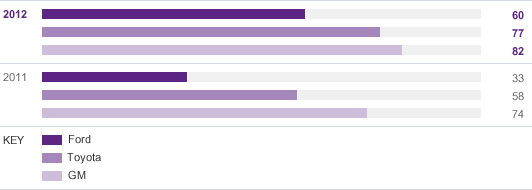
| 2011 | 2012 | |
|---|---|---|
| Ford | 33 | 60 |
| Toyota | 58 | 77 |
| GM | 74 | 82 |
- Third party rated (NHTSA)
Notes to Data
The National Highway Traffic Safety Administration (NHTSA) has significantly changed its New Car Assessment Program (NCAP), such that the results for 2011 and 2012 model year vehicles cannot be accurately compared to previous model years. For example, NHTSA has added a “rigid pole impact test” to assess side-impact safety (in addition to an existing side-impact test); implemented the use of a smaller dummy in the passenger seat in frontal and side impact tests; and made significant changes to the injury criteria. For detailed information on the new NCAP system, see www.safercar.gov, and in particular http://www.safercar.gov/staticfiles/toolkit/pdfs/faq.pdf (pdf, 213kb).
The data for the 2011MY NHTSA LINCAP percentages were misstated in our last report. The corrected data are included in this graph.
Related Links
In This Report:
F. IIHS Frontal Offset – Percent of Nameplates Achieving “Good” Rating
Data are for the model year noted.
Percent
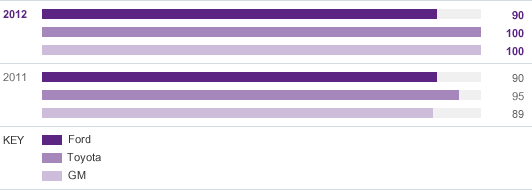
| 2011 | 2012 | |
|---|---|---|
| Ford | 90 | 90 |
| Toyota | 95 | 100 |
| GM | 89 | 100 |
- Third party rated (IIHS)
Related Links
In This Report:
External Websites:
G. Percent of Nameplates Achieving IIHS Top Safety Pick by Manufacturer
Data are for the model year noted.
Percent
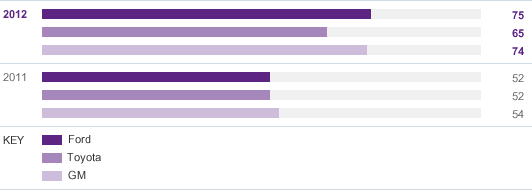
| 2011 | 2012 | |
|---|---|---|
| Ford | 52 | 75 |
| Toyota | 52 | 65 |
| GM | 54 | 74 |
- Third party rated (IIHS)
Related Links
In This Report:
External Websites:
H. U.S. Safety Recalls

| 2006 | 2007 | 2008 | 2009 | 2010 | 2011 | |
|---|---|---|---|---|---|---|
| Number of safety recalls | 11 | 15 | 10 | 8 | 7 | 13 |
| Number of units | 1,737,000 | 5,534,000 | 1,592,932 | 4,522,000 | 551,000 | 3,339,000 |
- Reported to regulatory authorities (NHTSA)
Notes to Data
In 2011, three recalls involved the high volume F-Series vehicle line, accounting for 2.706 million of the total vehicles affected. One other recall, involving older Windstar minivans, accounted for 425,000 of the total vehicles recalled in 2011. Note also, last year we reported that Ford issued 7 U.S. safety recalls in 2011. That was incorrect and the actual number of U.S. safety recalls in 2011 was 9. The number of units recalled was correctly reported.
