Data
Waste
Data on this page
A. Regional Waste to Landfill
Million kilograms
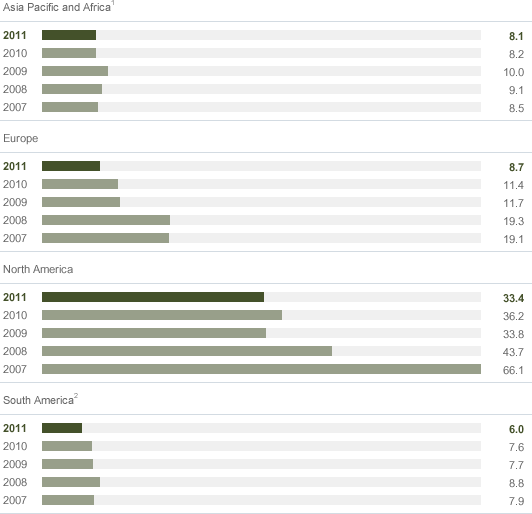
- Data managed through the Global Emissions Manager database
Notes to Data
- Waste-to-landfill data was restated for all years because casting sands (a type of waste) associated with the Geelong foundry (located in the Asia Pacific region) have been removed from the waste-to-landfill totals for years 2007–2011.
- Waste-to-landfill data was restated for all years because casting sands (a type of waste) associated with the Taubate foundry (located in the South America Region) have been removed from the waste-to-landfill totals for years 2007–2011.
AutoAlliance International, our joint-venture plant in Flat Rock, Michigan, that produces the Ford Mustang, is included beginning in 2009.
B. Waste to Landfill per Vehicle
Kilograms
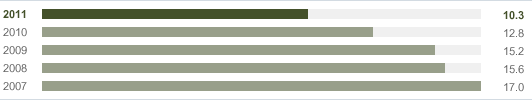
| 2007 | 2008 | 2009 | 2010 | 2011 |
|---|---|---|---|---|
| 17.0 | 15.6 | 15.2 | 12.8 | 10.3 |
- Data managed through the Global Emissions Manager database
Notes to Data
Waste-to-landfill data was restated for all years because casting sands (a type of waste) associated with Geelong foundry (located in the Asia Pacific region) and Taubate foundry (located in the South America Region) have been removed from the waste-to-landfill totals for years 2007–2011.
AutoAlliance International, our joint-venture plant in Flat Rock, Michigan, which produces the Ford Mustang, is included beginning in 2009.
Analysis
In 2011, we reduced waste to landfill on a per-vehicle basis by about 19.5 percent, which reflects our focus on reducing waste produced per unit of production. We decreased waste to landfill primarily through aggressive efforts to generate less waste and recycle more, and through the use of waste-to-energy incineration facilities.
C. Regional Hazardous Waste Generation
Million kilograms
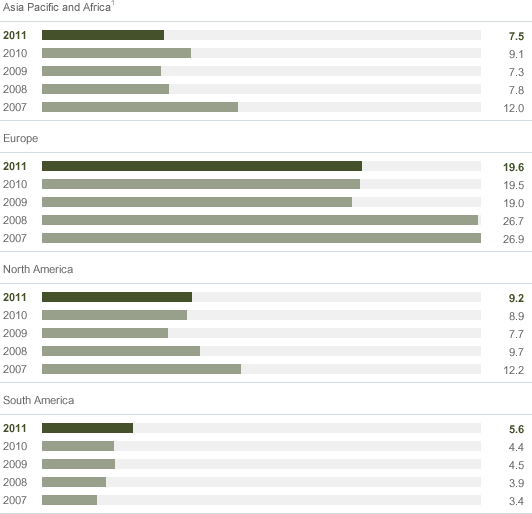
| 2007 | 2008 | 2009 | 2010 | 2011 | |
|---|---|---|---|---|---|
| Asia Pacific and Africa1 | 12.0 | 7.8 | 7.3 | 9.1 | 7.5 |
| Europe | 26.9 | 26.7 | 19.0 | 19.5 | 19.6 |
| North America | 12.2 | 9.7 | 7.7 | 8.9 | 9.2 |
| South America | 3.4 | 3.9 | 4.5 | 4.4 | 5.6 |
- Data managed through the Global Emissions Manager database
Notes to Data
- These figures were restated due to corrections in the data.
D. Hazardous Waste Generation per Vehicle
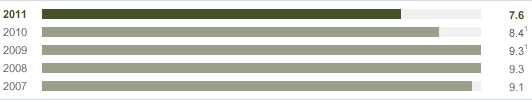
- Data managed through the Global Emissions Manager database
Notes to Data
- These figures were restated due to corrections in the data.
Analysis
In 2011, we continued a four-year improvement trend by reducing hazardous waste on a per-vehicle basis by 9.5 percent.