U.S. Energy Security
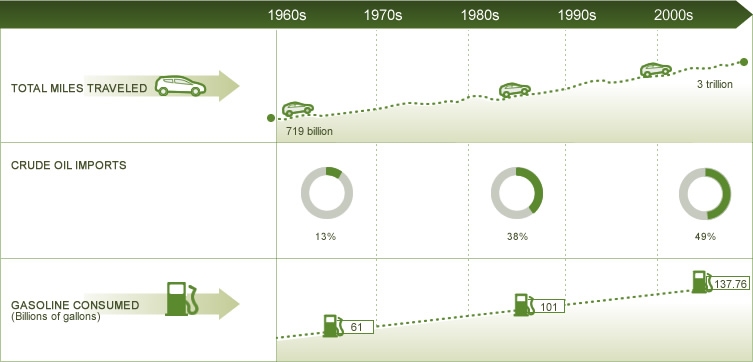
The following charts illustrate trends that affect concerns about U.S. energy security. The first chart shows the increase in the number of miles all U.S. drivers are traveling each year, the long-term trend towards an increasing percentage of crude oil imports and the increasing consumption of gasoline.
Since the 1970s, the fuel efficiency of new passenger cars more than doubled, and fuel economy rates in trucks have increased more than 50 percent. This increase is reflected in the first chart below, which shows that miles traveled increased by a factor of four while gasoline consumption increased by a little over a factor of two.
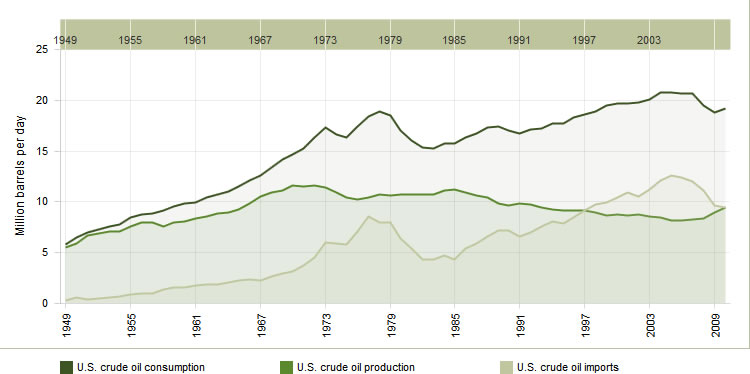
The second chart shows that U.S. demand for crude oil has declined. The economic downturn, improvements in vehicle fuel efficiency, and changes in consumer behavior have contributed to this decline. Unlike the utility sector, which has a diverse energy portfolio, light-duty transportation is approximately 95 percent reliant on crude oil. This dominance of crude oil, coupled with the continued reliance on foreign countries for supply, is at the core of the U.S. energy security concerns. The continued supply disruptions and instability in the Middle East and Africa have contributed to the significant increase in world crude prices during the first quarter of 2012. As crude oil is the most significant factor in the price of gasoline, some analysts are predicting possible record high gasoline prices during in 2012.
Crude Oil Consumption, Imports and U.S. Production