Ford’s Greenhouse Gas Emissions
We estimate that our total CO2 emissions are in the range of 350–400 million metric tons (Mmt) per year, varying over time with fluctuations in vehicle production and sales, on-road fleet size and vehicle miles traveled. The estimate includes emissions from our facilities, emissions from current-year vehicles and emissions from all Ford vehicles on the road.
We updated this estimate of global GHG emissions from our facilities and Ford vehicles in 2010, using data from 2008, the most recently available. The estimate is shown in Figure 1, along with the estimates carried out in 2001 and 2006/7 for the years 1999 and 2005, respectively. Please note that while we can exercise a significant degree of ongoing control over our facility emissions, we have essentially no control over the emissions of vehicles once they are produced and on the road.
We estimate that our total CO2 emissions are in the range of 350–400 million metric tons (Mmt) per year, varying over time with fluctuations in vehicle production and sales, on-road fleet size and vehicle miles traveled. The estimate includes emissions from our facilities, emissions from current-year vehicles and emissions from all Ford vehicles on the road. Please note that while we can exercise a significant degree of ongoing control over our facility emissions, we have essentially no control over the emissions of vehicles once they are produced and on the road.
Our assessment of the emissions from Ford’s facilities and Ford-made vehicles on the road decreased between 2005 and 2008 from approximately 400 to 350 million metric tons of CO2, primarily due to better data availability for a key parameter.1 Normalizing for the change in the key parameter, the emissions remained relatively stable at approximately 350 Mmt.
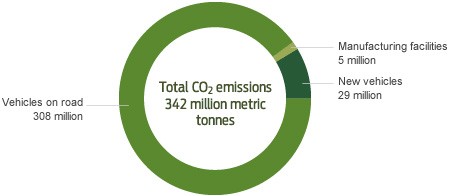
Figure 1: Estimate of CO2 emissions from our facilities and Ford vehicles on the road in 2008, 2005 and 1999.
Chart
Table
Metric tonnes
| CO2 emissions | |
|---|---|
| Manufacturing facilities | 5 million |
| New vehicles | 29 million |
| Vehicles on the road | 308 million |
| Total | 342 million |
In detail, the updated 2010 snapshot of estimated CO22 emissions shows that between 2005 and 2008:
- Emissions from our facilities improved by approximately 38 percent. This reflects an approximately 16 percent improvement in the amount of CO2 emitted per vehicle produced (i.e., our energy-efficiency index improved globally by about 16 percent from 2005 to 2008). It also reflects lower overall vehicle production. These estimates are fairly precise.3 Facility GHG emissions, however, are a small percentage (about 2 percent) of the total.
- Emissions from current-year (20084) vehicles on the road decreased by about 22 percent relative to the prior year, primarily reflecting a decline in vehicle sales. We have moderate confidence in the precision of the estimate for U.S. vehicles; the estimate for the rest of the world is less precise.5 These emissions account for about 8 percent of the total.
- Emissions from all Ford vehicles on the road are estimated to be about 308 million metric tons of CO2 per year, lower than in our previous analyses, primarily due to better data availability for a key parameter. This estimate, which accounts for about 90 percent of the total, remains highly uncertain.6
Outside the scope of this estimate, we are also in the process of understanding the GHG emissions from our key suppliers’ facilities. We are also expanding our approach to enhance supplier environmental performance beyond more-established supplier environmental performance expectations, which include robust environmental management systems (ISO 14001 certification) and responsible materials management. (See the Supplier Greenhouse Gas Emissions section for details of our participation in initial efforts to assess greenhouse gas emissions in our supply chain.)
Within the Aligned Business Framework agreement with our strategic suppliers, environmental leadership is integral to overall business performance metrics. Climate-change-related activities are highlighted as potential leadership opportunities. In addition, our requirement that suppliers implement robust environmental management systems will better enable them to understand, measure and report their emissions. We will also seek out opportunities to partner with suppliers to improve the greenhouse gas emissions performance of our products and processes, and improve energy efficiency throughout the vehicle lifecycle, including in the supply chain.
For more information on our efforts to quantify our suppliers’ greenhouse gas emissions please see Supplier Greenhouse Gas Emissions.
- Our estimate for the CO2 emissions for the greater-than-one-year-old on-road fleet decreased from 370 to 308 Mmt between 2005 and 2008. This decrease primarily reflects better data availability for a key value in the calculation (the global light-duty vehicle fraction of road transportation petroleum use, which we now assume to be 0.6 as opposed to 0.7 in our previous analyses). Using the old data value of 0.7 for the 2008 global CO2 estimate would increase the 308 Mmt value to 359 Mmt. Such changes in our assessment reflect the difficulties in assessing precisely the emissions from the global fleet of Ford vehicles.
- CO2 emissions account for substantially all of the GHG emissions from our facilities and vehicles.
- This is calculated consistent with the World Resources Institute/World Business Council for Sustainable Development Greenhouse Gas Protocol; it includes direct (Scope 1) and indirect (Scope 2) emissions.
- 2008 is the most recent year for which complete data are available.
- Calculated using Ford U.S. Corporate Average Fuel Economy and global market share figures. This estimate is subject to considerable uncertainty as it incorporates multiple assumptions about how consumers use their vehicles (e.g., miles traveled overall and urban/highway breakdown) and about fuel economy values in markets outside of the U.S.
- This is calculated based on our market share and a sector-based approach to determine the fractional contribution of light-duty vehicles to global total CO2 emissions. This estimate is subject to considerable uncertainty, as it is based on multiple assumptions, including that all automakers’ fleets have the same fuel economy and vehicle life span.