Engagement and Community
Data on this page
- Employee Satisfaction, Pulse Survey
- Overall Dealer Attitude
- Employment by Business Unit
- Total Purchases from Minority-owned Businesses – U.S.
- Total Purchases from Women-owned Businesses – U.S.
- U.S. Employment of Minority-group Personnel and Women at Year-end
- Charitable Contributions
- Volunteer Corps
- Working Conditions Assessment Status for Supply Chain
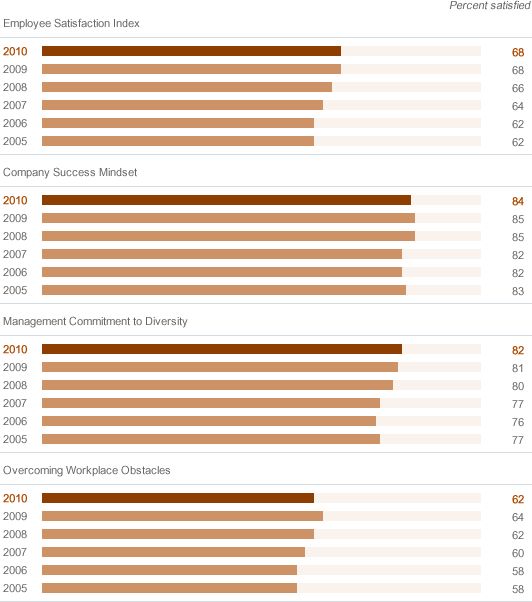
A. Employee Satisfaction, Pulse Survey

Percent satisfied
| 2005 | 2006 | 2007 | 2008 | 2009 | 2010 | |
|---|---|---|---|---|---|---|
| Employee Satisfaction Index | 62 | 62 | 64 | 66 | 68 | 68 |
| Company Success Mindset | 83 | 82 | 82 | 85 | 85 | 84 |
| Management Commitment to Diversity | 77 | 76 | 77 | 80 | 81 | 82 |
| Overcoming Workplace Obstacles | 58 | 58 | 60 | 62 | 64 | 62 |
Notes to Data
In 2006, the Pulse survey was changed to incorporate new dimensions. While there was no change to the number or content of the existing 55 core questions asked on Pulse, they were realigned into eight revised dimensions. These changes were made because the revised dimensions are better focused on current business priorities and can provide a framework for more focused feedback and action planning. In addition, the revised Employee Satisfaction Index can be benchmarked externally; none of the prior 13 dimensions could be benchmarked outside the Company.
Related Links
- In This Report:
B. Overall Dealer Attitude
Relative ranking on a scale of 1–100 percent
| 2005 | 2006 | 2007 | 2008 | 2009 | 2010 | |
|---|---|---|---|---|---|---|
| Ford (winter/summer score) | 72/70 | 64/64 | 64/69 | 69/68 | 71/80 | 83/85 |
| Lincoln Mercury (winter/summer score) | 64/64 | 64/62 | 64/66 | 66/64 | 66/71 | 71/62 |
| Industry (winter/summer score) | 74/74 | 71/70 | 70/72 | 73/72 | 70/74 | 75/78 |
Notes to Data
Overall dealer attitude is measured by the National Automobile Dealer Association (NADA) Dealer Attitude Survey. Scores are for the summer and winter respectively of the year noted.
Analysis
Approximately 64 percent of dealers provided feedback through the summer 2010 NADA survey process, which showed notable improvement in many areas – including some of the highest ratings ever from Ford and Lincoln Mercury dealers. With respect to our Ford dealers, we saw significant positive changes in every overall score. Our dealers rated us more favorably in terms of franchise value, policies and procedures, and people. In fact, the Overall Index Ranking shows Ford dealers moved up two spots and are now included in the Top 5 list of automotive brands.
Related Links
- In This Report:
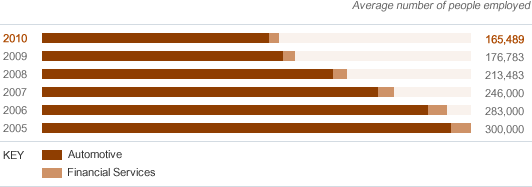
C. Employment by Business Unit

Average number of people employed
| 2005 | 2006 | 2007 | 2008 | 2009 | 2010 | |
|---|---|---|---|---|---|---|
| Total | 300,000 | 283,000 | 246,000 | 213,483 | 176,783 | 165,489 |
| Automotive | 286,000 | 270,000 | 235,000 | 203,316 | 168,610 | 158,470 |
| Financial Services | 14,000 | 13,000 | 11,000 | 10,167 | 8,173 | 7,019 |
- Reported to regulatory authorities
Notes to Data
These employee numbers do not include dealer personnel; 2009 employee numbers have been adjusted to reflect the new accounting standard on the deconsolidation of many of our variable interest entities.
Related Links
- In This Report:
D. Total Purchases from Minority-owned Businesses – U.S.
Notes to Data
From 2003 to 2007, purchases from non-minority, women-owned businesses were included within total purchases from all minority suppliers. Beginning in 2008, we provided separate data for women-owned businesses, which accounted in part for the reduced amount of purchases in 2008.
Analysis
In 2010, Ford purchased $3.8 billion in goods and services from approximately 200 minority-owned suppliers and more than $866 million in goods and services from more than 150 women-owned businesses. Our 2010 results were an improvement over 2009, exceeding our sourcing goals for both minority- and women-owned suppliers.
Related Links
- In This Report:
E. Total Purchases from Women-owned Businesses – U.S.
Notes to Data
From 2003 to 2007, purchases from non-minority, women-owned businesses were included within total purchases from all minority suppliers. In 2008, we began breaking out separate data for purchases from non-minority, women-owned businesses.
Analysis
In 2010, Ford purchased $3.8 billion in goods and services from approximately 200 minority-owned suppliers and more than $866 million in goods and services from more than 150 women-owned businesses. Our 2010 results were an improvement over 2009, exceeding our sourcing goals for both minority- and women-owned suppliers.
Related Links
- In This Report:
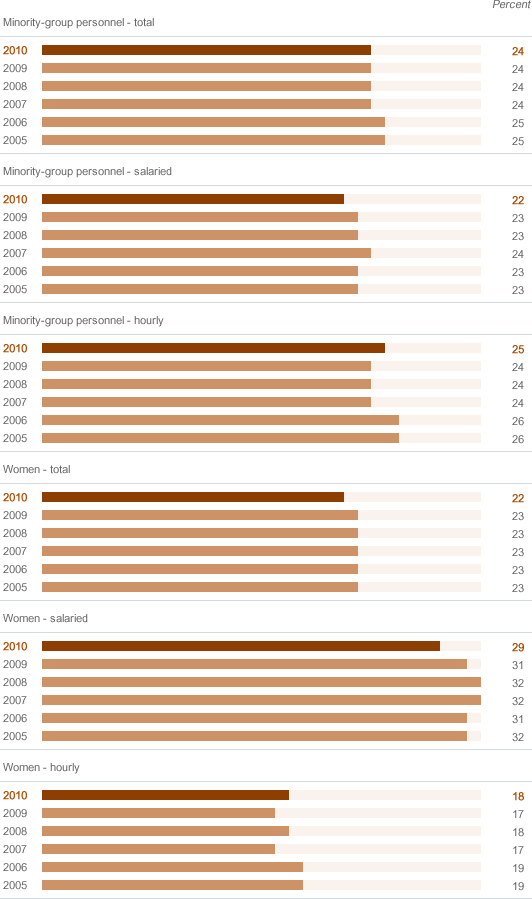
F. U.S. Employment of Minority-group Personnel and Women at Year-end

Percent
| 2005 | 2006 | 2007 | 2008 | 2009 | 2010 | |
|---|---|---|---|---|---|---|
| Minority-group personnel – total | 25 | 25 | 24 | 24 | 24 | 24 |
| Minority-group personnel – salaried | 23 | 23 | 24 | 23 | 23 | 22 |
| Minority group personnel – hourly | 26 | 26 | 24 | 24 | 24 | 25 |
| Women – total | 23 | 23 | 23 | 23 | 23 | 22 |
| Women – salaried | 32 | 31 | 32 | 32 | 31 | 29 |
| Women – hourly | 19 | 19 | 17 | 18 | 17 | 18 |
- Reported to regulatory authorities
Notes to Data
To align with the 2003–2007 reported data, 2008 data has been modified to reflect the total Company. Previously, 2008 data reported Ford Automotive data only.
Related Links
- In This Report:
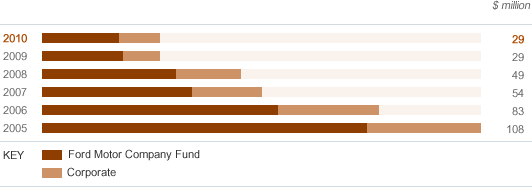
G. Charitable Contributions

$ million
| 2005 | 2006 | 2007 | 2008 | 2009 | 2010 | |
|---|---|---|---|---|---|---|
| Total | 108 | 83 | 54 | 49 | 29 | 29 |
| Ford Motor Company Fund | 80 | 58 | 37 | 33 | 20 | 19 |
| Corporate | 28 | 25 | 17 | 16 | 9 | 10 |
Analysis
The total amount is the same as 2009, but less than in previous years, reflecting the challenging business conditions that affected the Company's core automotive business in 2010.
Related Links
- In This Report:
H. Volunteer Corps
Notes to Data
The Ford Volunteer Corps was founded in 2005, and 2006 is the first year data are available. However, volunteerism and community service have long been a part of Ford’s culture, and these efforts were formalized in 1997 with the creation of the 16-hour Community Service Program.
Related Links
- In This Report:
I. Working Conditions Assessment Status for Supply Chain
| Working Conditions Assessments (as of 12/31/10) | Americas | Asia Pacific and Africa | Europe | Global Total |
|---|---|---|---|---|
| Average violations per assessment | 11.4 | 10.4 | 11.5 | 10.8 |
| Assessments completed to date | 250 | 438 | 63 | 751 |
| Follow-up assessments completed to date (third party and/or internal) | 227 | 408 | 67 | 702 |
| Working Conditions Training (as of 12/31/10) | Americas | Asia Pacific and Africa | Europe | Global Total |
|---|---|---|---|---|
| Training sessions completed to date | 54 | 42 | 11 | 107 |
| Total number of attending companies (i.e., individual GSDB code sites or # suppliers attended) | 685 | 708 | 262 | 1,655 |
| Total number of trained managers | 1,192 | 716 | 241 | 2,149 |
| Working Conditions Training: (Scope of Impact: Supplier-Submitted Data as of 12/31/10) | Global Total |
|---|---|
| Training cascade to management, individuals trained | 18,139 |
| Training cascade to workforce, individuals trained | 318,593 |
| Communication to suppliers, number of sub-tier companies | 56,284 |
- Related Links
Related Links
- Overview
- Economy Data
- Environment Data
- Society Data


