Tailpipe Emissions
Data on this page
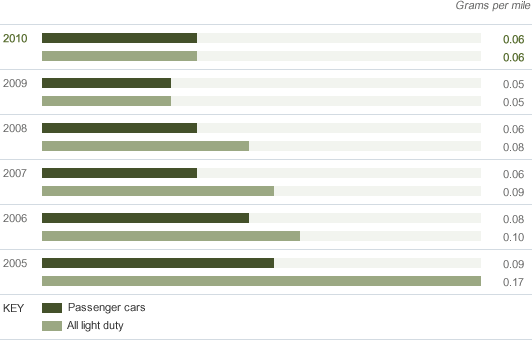
A. Ford U.S. Average NOx Emissions

Grams per mile
| 2005 | 2006 | 2007 | 2008 | 2009 | 2010 | |
|---|---|---|---|---|---|---|
| Passenger cars | 0.09 | 0.08 | 0.06 | 0.06 | 0.05 | 0.06 |
| All light duty | 0.17 | 0.10 | 0.09 | 0.08 | 0.05 | 0.06 |
- Reported to regulatory authorities (EPA)
Analysis
In 2010, Ford’s average NOx emissions increased slightly for the first time in seven years.
Related Links
- In This Report:
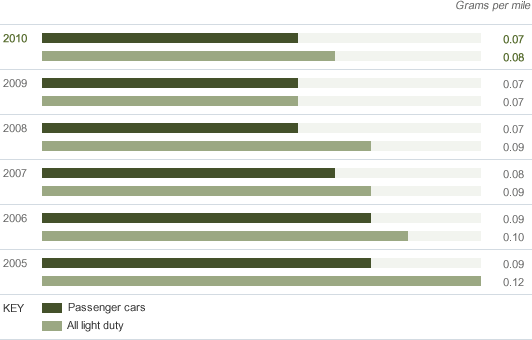
B. Ford U.S. Average NMOG Emissions

Grams per mile
| 2005 | 2006 | 2007 | 2008 | 2009 | 2010 | |
|---|---|---|---|---|---|---|
| Passenger cars | 0.09 | 0.09 | 0.08 | 0.07 | 0.07 | 0.07 |
| All light duty | 0.12 | 0.10 | 0.09 | 0.09 | 0.07 | 0.08 |
- Reported to regulatory authorities (EPA)
Notes to Data
NMOG = Non-Methane Organic Gases
Analysis
In 2010, Ford’s average NMOG emissions remained the same for passenger cars, and increased slightly for all light-duty vehicles for the first time in seven years.
Related Links
- In This Report:
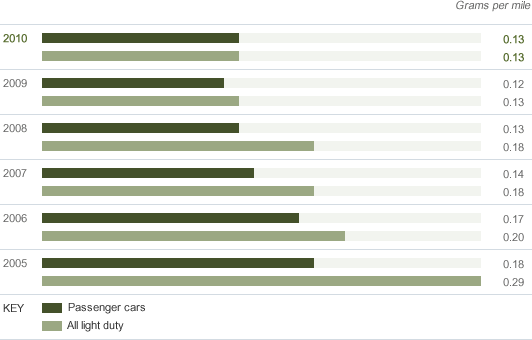
C. Ford U.S. Average Vehicle Emissions

Grams per mile
| 2005 | 2006 | 2007 | 2008 | 2009 | 2010 | |
|---|---|---|---|---|---|---|
| Passenger cars | 0.18 | 0.17 | 0.14 | 0.13 | 0.12 | 0.13 |
| All light duty | 0.29 | 0.20 | 0.18 | 0.18 | 0.13 | 0.13 |
- Reported to regulatory authorities (EPA)
Notes to Data
Average vehicle emissions are the smog-forming pollutants from vehicle tailpipes, characterized as the sum of [(NMOG + NOx emissions) x volume] for all products in the fleet.
Analysis
In 2010, Ford’s average vehicle emissions remained the same for all light-duty vehicles, and increased slightly for passenger cars for the first time in seven years.
Related Links
- In This Report:
- Overview
- Economy Data
- Environment Data
- Society Data
