Engagement and Community
-
Society
- Who Are Our Stakeholders?
- Progress
- Employees
- Dealers
- Suppliers
- Customers
- Community
-
Data
- Engagement and Community
- Workplace Safety
- Vehicle Safety
- Case Studies
Data On This Page
- Employee Satisfaction, Pulse Survey
- Overall Dealer Attitude
- Employment by Business Unit
- Total Purchases from Minority-owned Businesses – United States
- Total Purchases from Women-owned Businesses – United States
- U.S. Employment of Minority-group Personnel and Women at Year-end
- Charitable Contributions
- Volunteer Corps
- Working Conditions Assessment Status for Supply Chain
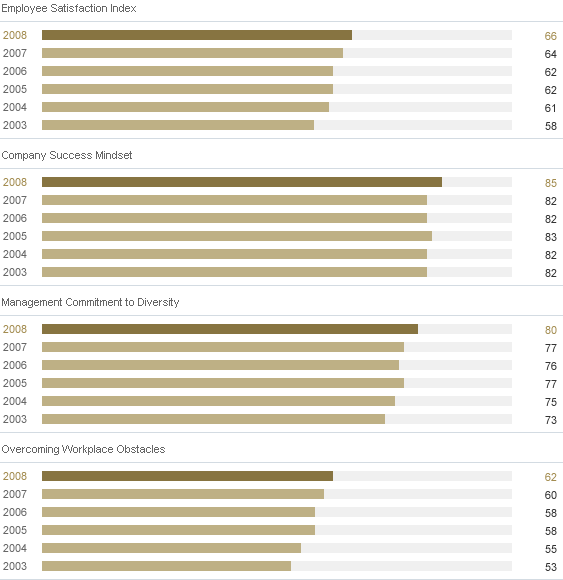
A. Employee Satisfaction, Pulse Survey
| 2003 | 2004 | 2005 | 2006 | 2007 | 2008 | |
|---|---|---|---|---|---|---|
| Employee Satisfaction Index | 58 | 61 | 62 | 62 | 64 | 66 |
| Company Success Mindset | 82 | 82 | 83 | 82 | 82 | 85 |
| Management Commitment to Diversity | 73 | 75 | 77 | 76 | 77 | 80 |
| Overcoming Workplace Obstacles | 53 | 55 | 58 | 58 | 60 | 62 |
B. Overall Dealer Attitude
| 2003 | 2004 | 2005 | 2006 | 2007 | 2008 | |
|---|---|---|---|---|---|---|
| Ford (summer/winter score) | 67/64 | 70/69 | 70/72 | 64/64 | 69/64 | 68/69 |
| Lincoln Mercury (summer/winter score) | 56/50 | 64/61 | 64/64 | 62/64 | 66/64 | 64/66 |
| Industry (summer/winter score) | 72/72 | 73/74 | 74/74 | 70/71 | 72/70 | 72/73 |
C. Employment by Business Unit
| 2003 | 2004 | 2005 | 2006 | 2007 | 2008 | |
|---|---|---|---|---|---|---|
| Total | 327,531 | 324,864 | 300,000 | 283,000 | 246,000 | 213,483 |
| Automotive | 278,909 | 276,029 | 286,000 | 270,000 | 235,000 | 203,316 |
| Financial Services | 48,622 | 48,835 | 14,000 | 13,000 | 11,000 | 10,167 |
- Reported to regulatory authorities
D. Total Purchases from Minority-owned Businesses – United States
| 2003 | 2004 | 2005 | 2006 | 2007 | 2008 |
|---|---|---|---|---|---|
| 3.4 | 3.7 | 3.7 | 3.7 | 4.2 | 3.3 |
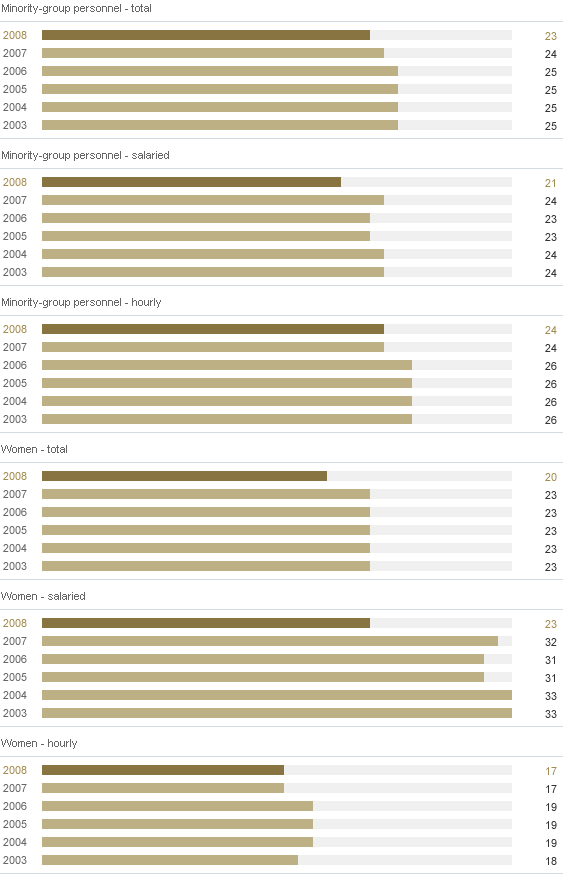
F. U.S. Employment of Minority-group Personnel and Women at Year-end
| 2003 | 2004 | 2005 | 2006 | 2007 | 2008 | |
|---|---|---|---|---|---|---|
| Minority-group personnel – total | 25 | 25 | 25 | 25 | 24 | 23 |
| Minority-group personnel – salaried | 24 | 24 | 23 | 23 | 24 | 21 |
| Minority-group personnel – hourly | 26 | 26 | 26 | 26 | 24 | 24 |
| Women – total | 23 | 23 | 23 | 23 | 23 | 20 |
| Women – salaried | 33 | 33 | 31 | 31 | 32 | 23 |
| Women – hourly | 18 | 19 | 19 | 19 | 17 | 17 |
- Reported to regulatory authorities
G. Charitable Contributions
| 2003 | 2004 | 2005 | 2006 | 2007 | 2008 | |
|---|---|---|---|---|---|---|
| Total | 121 | 111 | 108 | 83 | 54 | 49 |
| Ford Motor Company Fund | 78 | 78 | 80 | 58 | 37 | 33 |
| Corporate | 43 | 33 | 28 | 25 | 17 | 16 |
I. Working Conditions Assessment Status for Supply Chain
| Working Conditions Assessments (as of 12/31/08) | Americas | Asia Pacific and Africa | Europe | Global Total |
|---|---|---|---|---|
| Average violations per assessment | 11.4 | 11.1 | 13.5 | 11.4 |
| Assessments completed to date | 97 | 284 | 37 | 418 |
| Follow-up assessments completed to date (third party and/or internal) | 36 | 130 | 1 | 167 |
| Working Conditions Training (as of 12/31/08) | Americas | Asia Pacific and Africa | Europe | Global Total |
|---|---|---|---|---|
| Training sessions completed to date | 20 | 15 | 7 | 42 |
| Total number of attending companies | 583 | 471 | 171 | 1,225 |
| Total number of trained managers | 758 | 548 | 222 | 1,528 |
| Scope of Impact: Suppler-Submitted Data | Global Total |
|---|---|
| Training cascade to management, individuals trained | 6,239 |
| Training cascade to workforce, individuals trained | 81,963 |
| Communication to suppliers, number of sub-tier companies | 10,079 |
Notes to the Data
Chart A
In 2006, the Pulse survey was changed to incorporate new dimensions. While there was no change to the number or content of the existing 55 core questions asked on Pulse, they were realigned into eight revised dimensions. These changes were made because the revised dimensions are better focused on current business priorities and can provide a framework for more focused feedback and action planning. In addition, the revised Employee Satisfaction Index can be benchmarked externally; none of the prior 13 dimensions could be benchmarked outside the Company.
Chart B
Overall dealer attitude is measured by the National Automobile Dealer Association (NADA) Dealer Attitude Survey. Scores are for the summer and winter respectively of the year noted. Due to a data compilation error, we incorrectly reported the 2007 NADA scores in our 2007/08 Sustainability Report. The 2007 numbers are presented accurately in this year's tables.
Chart C
The approximate number of individuals employed by us and our consolidated entities (including entities we do not control) as of year end. The decrease in employment levels primarily reflects implementation of our personnel-reduction programs in North America.
Chart D
From 2003 to 2007, purchases from non-minority, women-owned businesses were included within total purchases from all minority suppliers. Beginning in 2008, we are providing separate data for women-owned businesses, which accounts in part for the reduced amount of purchases in 2008.
Chart E
From 2003 to 2007, purchases from non-minority, women-owned businesses were included within total purchases from all minority suppliers. In 2008, we began breaking out separate data for purchases from non-minority, women-owned businesses.
Chart G
Ford Fund and corporate contributions
See the Community section for a description of our charitable contributions.
Chart H
The Ford Volunteer Corps was founded in 2005, and 2006 is the first year data are available. However, volunteerism and community service have long been a part of Ford's culture, and these efforts were formalized in 1997 with the creation of the 16-hour Community Service Program.


