Vehicle
During 2008 and early 2009, we introduced vehicles and technologies consistent with our blueprint for sustainability and CO2 reduction goal.

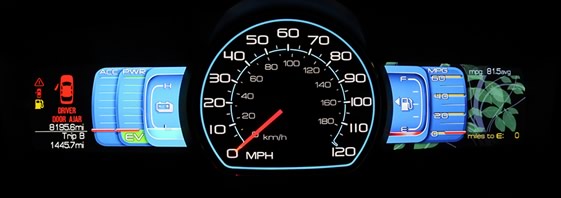
The Ford Fusion Hybrid's SmartGauge™ with EcoGuide gives drivers information to help them maximize fuel efficiency.
- In the United States, we introduced two new hybrid vehicles: the Ford Fusion and Mercury Milan Hybrids. These vehicles have been rated by the U.S. Environmental Protection Agency (EPA) at 41 mpg in city driving and 36 mpg highway, making them the most fuel-efficient midsize sedans in America. We now offer four hybrid models and have sold more than 100,000 to date.
- We are offering EcoBoost™ technology on the 2010 Lincoln MKS, Lincoln MKT, Taurus SHO and Ford Flex in North America. EcoBoost uses a combination of turbocharging, direct injection and reduced displacement to deliver significant fuel-efficiency gains without sacrificing engine power or performance, improving vehicle fuel economy up to 20 percent and reducing CO2 emissions up to 15 percent compared to larger displacement engines. EcoBoost, which will be offered globally, is also more affordable than many other fuel-efficiency technologies. By 2013, Ford will have EcoBoost V-6 and I-4 engines in approximately 1.3 million vehicles per year. In North America, 90 percent of Ford's nameplates will offer the technology.
- In 2008, we introduced the Ford Fiesta ECOnetic, which gets more than 62 mpg (approximately 78 mpg in Imperial gallons)1 and emits just 98 g/km of CO2, making it the most fuel-efficient five-seat family car in the UK. It joins the ECOnetic European Focus and Mondeo models, all of which use specially calibrated versions of already fuel-efficient diesel engines to achieve outstanding economy and emissions performance.
- We are using multiple fuel-saving technologies in all of our new vehicles. For example, through a combination of aerodynamics and other improvements, we improved the fuel economy of the entire 2009 F-150 lineup by an average of eight percent. We also introduced an F-150 Special Fuel Economy edition that delivers 21 mpg in highway driving, a 12 percent improvement in fuel economy over previous models and best-in-class fuel economy for full-size pickup trucks. In its most popular midsize engine, the 2009 F-150 gets unsurpassed fuel economy with 15 mpg city/20 mpg highway, which beats the Toyota Tundra's 14 city/17 highway with a comparable engine.2
More details about Ford's best-in-class vehicles are available in the Economy section of this report.
For the 2008 model year, the Corporate Average Fuel Economy (CAFE) of our cars and trucks increased by 2.9 percent relative to 2007. Preliminary data for the 2009 model year indicates that the CAFE of our cars and trucks will improve by another 4.0 percent compared to 2008.
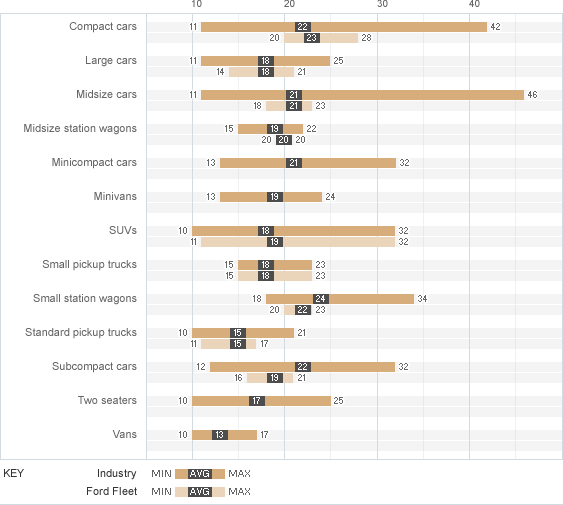
As seen in the chart of Fuel Economy of U.S. Ford Vehicles by EPA Segment, our 2009 model U.S. vehicles are generally competitive with others in the industry in fuel economy, ranking better than average in three of nine categories, worse in two and the same in four.
In Europe, we have reduced the average CO2 emissions of the vehicles we sell by 18.9 to 22.9 percent depending on the brand, compared with a 1995 baseline. We have achieved these reductions by introducing a variety of innovations, including an advanced common-rail diesel engine, available on many of our vehicles, and lightweight materials. Ford is working on hybrid applications specifically designed to deliver benefits for the European market. Rather than full hybrids, in Europe we expect to see the widespread adoption of component parts of hybrid technologies. For example, "stop-start" systems and regenerative breaking will provide a cost-effective way to reduce CO2 emissions. We are also developing a diesel micro-hybrid, which seems well-suited to the European driving environment and builds on the widespread acceptance of diesel technology, offering the best combination of performance, fuel economy and affordability for the region.
Improvements in the fuel economy of our vehicles will accelerate as we implement our Sustainable Technologies and Alternative Fuels Plan, which includes short-, medium- and long-term actions. The short-term actions have been incorporated into our cycle plan, which specifies the vehicles we will build in the next five years. We are actively researching and developing the technologies to be used in the mid to long term, including diesel hybrids and other clean diesel technologies; plug-in hybrids; biofueled vehicles; hydrogen internal-combustion engines; hydrogen fuel cell powertrains; and various combinations of these technologies, plus weight reductions.
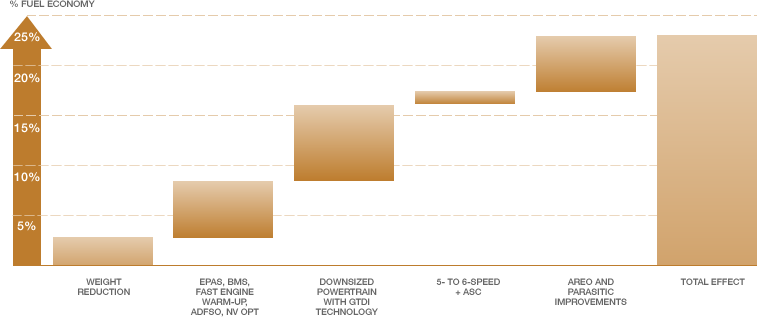
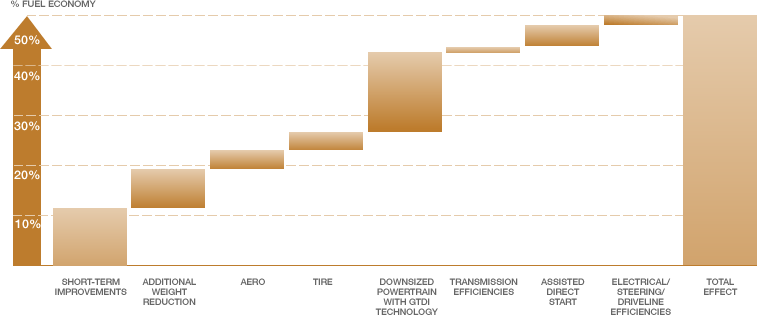
The figures below show how we will leverage complementary technologies to cut CO2 emissions significantly.
Fuel Economy of U.S. Ford Vehicles by EPA Segment
| Industry | Ford | |||||
|---|---|---|---|---|---|---|
| Minimum | Average | Maximum | Minimum | Average | Maximum | |
| Total | 10 | 19 | 46 | 11 | 19 | 32 |
| Compact cars | 11 | 22 | 42 | 20 | 23 | 28 |
| Large cars | 11 | 18 | 25 | 14 | 18 | 21 |
| Midsize cars | 11 | 21 | 46 | 18 | 21 | 23 |
| Midsize station wagons | 15 | 19 | 22 | 20 | 20 | 20 |
| Minicompact cars | 13 | 21 | 32 | - | - | - |
| Minivans | 13 | 19 | 24 | - | - | - |
| SUVs | 10 | 18 | 32 | 11 | 19 | 32 |
| Small pickup trucks | 15 | 18 | 23 | 15 | 18 | 23 |
| Small station wagons | 18 | 24 | 34 | 20 | 22 | 23 |
| Standard pickup trucks | 10 | 15 | 21 | 11 | 15 | 17 |
| Subcompact cars | 12 | 22 | 32 | 11 | 15 | 17 |
| Two seaters | 10 | 17 | 25 | - | - | - |
| Vans | 10 | 13 | 17 | - | - | - |
Related Links
- In This Report:
- Vehicle Web Sites:
Typical Near-Term Fuel Economy Improvements – Midsize Utility

Typical Mid-Term Fuel Economy Improvements – Small Car

For an explanation of the terms used in these figures, see the glossary.
Please note that improvements in fuel economy resulting from the use of the technologies identified in the above charts are often not additive or linear. The charts depict approximate percentage improvements estimated for particular technologies in a generic vehicle; actual improvements will vary depending on the characteristics of each specific vehicle.
