Water Use
Data On This Page
A. Global Water Use per Vehicle Produced
Cubic meters per vehicle produced
| 2003 | 2004 | 2005 | 2006 | 2007 | 2008 |
|---|---|---|---|---|---|
| 8.88 | 7.94 | 7.82 | 7.76 | 6.21 | 5.67 |
- Data managed through the Global Emissions Manager database
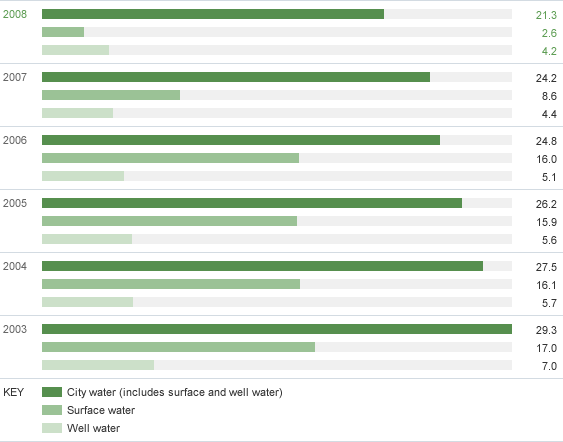
B. Global Water Use by Source
Million cubic meters
| 2003 | 2004 | 2005 | 2006 | 2007 | 2008 | |
|---|---|---|---|---|---|---|
| City water (includes surface and well water) | 29.3 | 27.5 | 26.2 | 24.8 | 24.2 | 21.3 |
| Surface water | 17.0 | 16.1 | 15.9 | 16.0 | 8.6 | 2.6 |
| Well water | 7.0 | 5.7 | 5.6 | 5.1 | 4.4 | 4.2 |
- Data managed through the Global Emissions Manager database
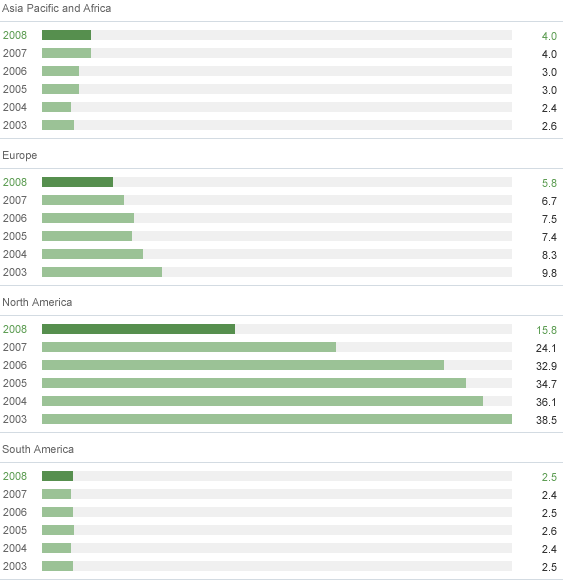
C. Regional Water Use
Premier Automotive Group is now included in Europe
Million cubic meters
| 2003 | 2004 | 2005 | 2006 | 2007 | 2008 | |
|---|---|---|---|---|---|---|
| Asia Pacific and Africa | 2.6 | 2.4 | 3.0 | 3.0 | 4.0 | 4.0 |
| Europe | 9.8 | 8.3 | 7.4 | 7.5 | 6.7 | 5.8 |
| North America | 38.5 | 36.1 | 34.7 | 32.9 | 24.1 | 15.8 |
| South America | 2.5 | 2.4 | 2.6 | 2.5 | 2.4 | 2.5 |
- Data managed through the Global Emissions Manager database
Notes to the Data
Chart A
Global water use per vehicle is being restated for all years due to a calculation error. Total global water use and total water use by region numbers are unaffected.


