Fuel Economy and CO2 Emissions
Data On This Page
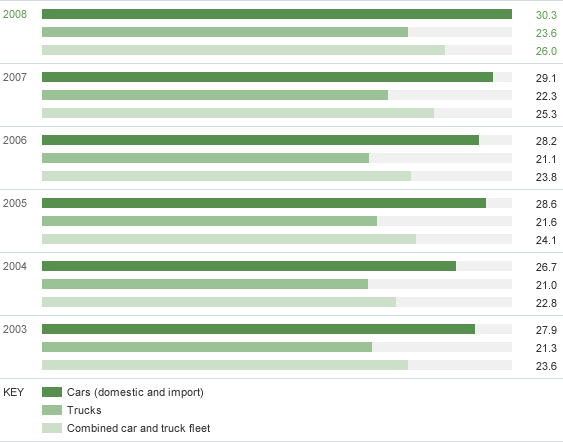
A. Ford U.S. Corporate Average Fuel Economy
Miles per gallon
| 2003 | 2004 | 2005 | 2006 | 2007 | 2008 | |
|---|---|---|---|---|---|---|
| Cars (domestic and import) | 27.9 | 26.7 | 28.6 | 28.2 | 29.1 | 30.3 |
| Trucks | 21.3 | 21.0 | 21.6 | 21.1 | 22.3 | 23.6 |
| Combined car and truck fleet | 23.6 | 22.8 | 24.1 | 23.8 | 25.3 | 26.0 |
- Reported to regulatory authorities (EPA)
B. Ford U.S. CO2 Tailpipe Emissions per Vehicle (Combined Car and Truck Fleet Average CO2 Emissions)
Grams per mile
| 2003 | 2004 | 2005 | 2006 | 2007 | 2008 |
|---|---|---|---|---|---|
| 375 | 387 | 368 | 371 | 352 | 340 |
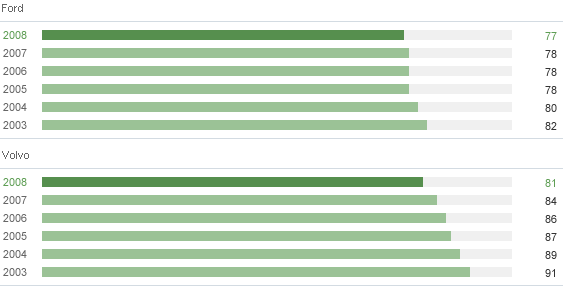
C. European CO2 Performance, Passenger Vehicles – Percent of 1995 Base
1995 base = 100 percent
Percent
| 2003 | 2004 | 2005 | 2006 | 2007 | 2008 | |
|---|---|---|---|---|---|---|
| Ford | 82 | 80 | 78 | 78 | 78 | 77 |
| Volvo | 91 | 89 | 87 | 86 | 84 | 81 |
Notes to the Data
Chart A
See the Fuel Economy and Greenhouse Gas Emissions section for a discussion of our Corporate Average Fuel Economy (CAFE) performance. For the 2008 model year, the CAFE of our cars and trucks increased by 2.9 percent relative to 2007. Preliminary data for the 2009 model year indicates that the CAFE of our cars and trucks will improve by another 4.0 percent compared to 2008. Improvement is reflected in increasing miles per gallon.
Chart B
See the Climate Change section for a discussion of our CO2 emissions performance. Improvement is reflected in decreasing grams per mile.


