
Shop for a Vehicle

Financial Reports and SEC Filings
Financial Reports & SEC FilingsQ4 2008 Results
Ford Reports 4th Quarter 2008 Net Loss of $5.9 Billion; Gained Market Share In U.S., Europe, Achieved Cost Target
Download Full Financial Release (PDF)
Download Slides(PDF)
- Net loss of $5.9 billion, or $2.46 per share, for the fourth quarter of 2008 amid a sharp global decline in vehicle demand; pre-tax loss of $3.7 billion from continuing operations, excluding special items. ++
- Reduced Automotive costs by $1.4 billion in fourth quarter and $4.4 billion in 2008 versus year-ago levels. Achieved $5.1 billion in North America cost reductions at year-end 2008 compared with 2005, excluding favorable impact of depreciation and amortization from asset impairment at the end of the second quarter.
- Decisively reduced global dealer stocks by more than 50,000 vehicles compared with the third quarter. Ford now has among the lowest days’ supply in the industry.
- Product transformation continues to gain strength, helping the company to gain market share in Europe for fourth quarter and full year, and in the U.S. in the fourth quarter.
- Total liquidity of $24 billion, including Automotive gross cash of $13.4 billion, at Dec. 31, 2008. +++
- Ford is drawing its available credit lines due to concerns about the instability of the capital markets with the uncertain state of the economy. The $10.1 billion will be added to company cash for the first quarter 2009.
- The United Auto Workers union has agreed to end the “jobs bank” at Ford. The company and the union are presently working out the details of implementation.
- Based on current planning assumptions, Ford has sufficient Automotive liquidity to fund its business plan and product investments and does not need a bridge loan from the U.S. government.
- Ford remains on track for both its overall and its North American Automotive pre-tax results to be at or above breakeven in 2011, excluding special items.
| Financial Results Summary | Fourth Quarter | Full Year | ||
|
| 2008 | O/(U) 2007 | 2008 | O/(U) 2007 |
| Wholesales (000) ++ | 1,138 | (505) | 5,404 | (1,149) |
| Revenue (Bils.) ++ | $ 29.2 | $ (16.3) | $ 139.3 | $ (34.6) |
|
|
|
|
|
|
| Continuing Operations ++ |
|
|
|
|
| Automotive Results (Mils.) | $ 3,279) | $ 2,390) | $ (6,203) | $ (5,105) |
| Financial Services (Mils.) | (384) | (653) | ( 495) | (1,719) |
| Pre-Tax Results (Mils.) | $ (3,663) | $ 3,043) | $ (6,698) | $ 6,824) |
|
|
|
|
|
|
| After-Tax Results (Mils.) | $ (3,273) | $ 2,786) | $ (7,119) | $ 6,695) |
|
|
|
|
|
|
| Earnings Per Share ++++ | $ (1.37) | $ (1.14) | $ (3.13) | $ (2.92) |
|
|
|
|
|
|
| Special Items Pre-Tax (Mils.) | $ (1,386) | $ 2,466 | $ (7,605) | $ (3,733) |
|
|
|
|
|
|
| Net Income |
|
|
|
|
| After-Tax Results (Mils.) | $ (5,875) | $ (3,064) | $ (14,571) | $ (11,848) |
| Earnings Per Share | $ (2.46) | $ (1.13) | $ (6.41) | $ (5.03) |
|
|
|
|
|
|
| Automotive Gross Cash (Bils.) +++ | $ 13.4 | $ (21.2) | $ 13.4 | $ (21.2) |
See end notes on page 11.
Download Full Financial Release (PDF)
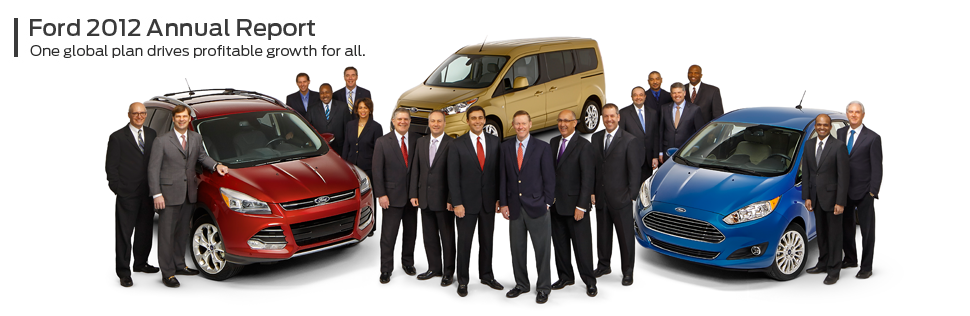
Ford Achieves Strong Financial Results in 2012 with 14 Straight Quarters of Operating Profit
Redefined Midsize Sedan
 2013 Ford Fusion offers an unprecedented array of Driver Assist Technologies.
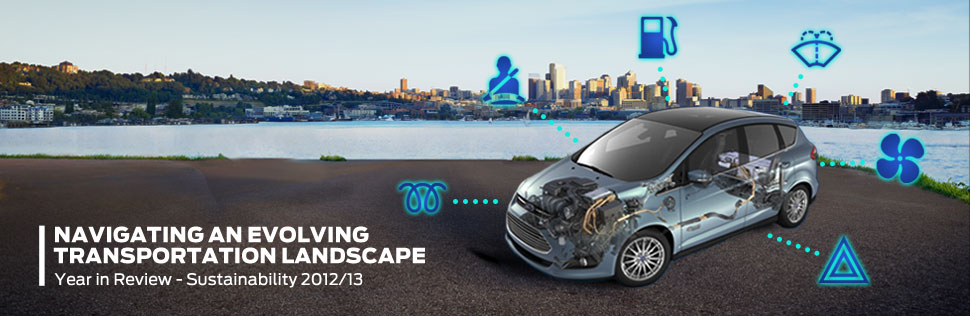
2012/13 Sustainability Report
 We are committed to contributing global sustainability solutions by using resources responsibly.
One Team, Many Opportunities
 From Manufacturing to IT, we invite you to learn about careers at Ford.