![]()
Sustainability 2012/13
Employee Satisfaction
Each year, we ask our salaried workforce to participate in the Pulse survey to gain insight into employees’ overall satisfaction with the Company, their jobs, diversity and other aspects of their workplace experience. We encourage our employees to provide candid feedback, and we benchmark results and participation externally. Results of the survey are incorporated into our business planning review processes. Improving Pulse scores is an annual performance objective for many of our senior managers.
In 2012, 75 percent of our salaried employees across the globe participated in the survey, which included a total of 55 multiple-choice questions across 12 dimensions of workplace life, including training and development, management’s commitment to diversity, and workplace safety practices. The results of the 2012 survey were highly favorable, with nine of the dimensions improved over 2011 and two unchanged. One dimension, which measured employee awareness and understanding of the Company’s Go Further brand promise, was new for the 2012 survey.
The Employee Satisfaction Index (ESI) section of the survey, which asks employees questions such as whether they feel valued at work or whether they believe they are rewarded for their job performance, increased 2 percentage points from 2011. Considered the bellwether of employee satisfaction, Ford’s ESI score is 5 percentage points above the Company’s benchmark, which is comprised of a group of Fortune 500 companies.
Within the ESI, the highest score – 13 percent above the external benchmark – was for the question that asked employees whether they feel satisfied with the information they receive from management on what’s going on with the Company.
This year’s survey also showed improvement – an increase of 4 percentage points – over last year in the area that measures management’s commitment to diversity. Two of the five questions that improved most were from the diversity category.
Not all questions saw improved results, however. Questions that resulted in lower scores this year included:
- “My workload does not interfere with my ability to do a quality job” – down 2 percentage points from the prior year to 64 percent.
- “My work group planned actions based on the results of the last Pulse survey” – down 1 percentage point to 66 percent.
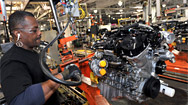
In 2012, we surveyed hourly employees on health and safety, along with other topics, for the first time. The objective was to collect feedback from our hourly workforce to establish baseline metrics, measure the effectiveness of the ONE Ford strategy and its impact on employee satisfaction, and guide continuous improvement efforts in our manufacturing operations. Plant locations in nine countries participated, generating feedback from more than 22,000 employees. The survey included a minimum of 20 questions that were consistent with questions asked in the salaried Pulse survey. Regions could add more questions as needed. The most favorable responses were around Company mindset and quality work practices. Results were slightly below the salaried workforce scores, but within 10 percentage points. Improvement efforts will focus on the effective implementation of our overall Ford Production System, which encompasses safety, quality, delivery, cost, people, maintenance and environment. Read more in the Health and Safety section of this report.
As part of our efforts to increase satisfaction, we are constantly improving our strategies for fostering open dialogue with employees. Read more in the Employee Engagement section.
In addition, each year following the survey, we send managers and supervisors throughout Ford a report that shows how their specific teams responded to the questions on the survey. The goal is for the managers and supervisors to then meet with their work groups, discuss the results, and plan changes to improve the way their teams function.
For more information on the Pulse survey, see the Data section of this report.
- Year in Review
-
Our Blueprint for Sustainability
Our Blueprint for Sustainability
-
Financial Health
Financial Health
-
Climate Change and the Environment
Climate Change and the Environment
- Water
-
Vehicle Safety and Driver Assist Technologies
Vehicle Safety and Driver Assist Technologies
- Supply Chain
- People
-
Ford Around the World
Ford Around the World


Our Sustainability Data
Downloads
Ford’s 2012/13 Sustainability Report is summarized in this 8-page downloadable document.
- Download now (2.64Mb)
Visit our Downloads page for this report in full or as separate sections along with supplementary publications.