![]()
Sustainability 2012/13
Data: Engagement and Community
Data on this page
A. Employee Satisfaction, Pulse Survey
Percent satisfied
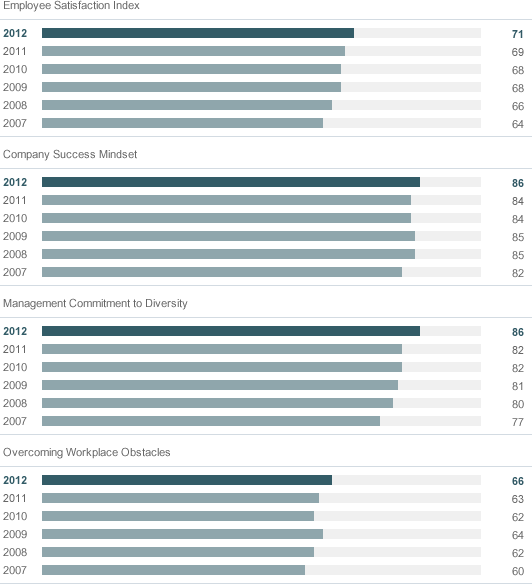
| 2007 | 2008 | 2009 | 2010 | 2011 | 2012 | |
|---|---|---|---|---|---|---|
| Employee Satisfaction Index | 64 | 66 | 68 | 68 | 69 | 71 |
| Company Success Mindset | 82 | 85 | 85 | 84 | 84 | 86 |
| Management Commitment to Diversity | 77 | 80 | 81 | 82 | 82 | 86 |
| Overcoming Workplace Obstacles | 60 | 62 | 64 | 62 | 63 | 66 |
Notes to Data
Each year, we ask our salaried workforce to participate in the Pulse survey to gain insight into employees’ overall satisfaction with the Company, their jobs, diversity and other aspects of workplace satisfaction.
In 2012, the Employee Satisfaction Index continued a nine-year trend of scores equal to or better than the prior year. The topic of Management Commitment to Diversity continued a six-year trend of scores equal to or better than the prior year.
B. Overall Dealer Attitude
Relative ranking on a scale of 1–100 percent
| 2007 | 2008 | 2009 | 2010 | 2011 | 2012 | |
|---|---|---|---|---|---|---|
| Ford (winter/summer score) | 64/69 | 69/68 | 71/80 | 83/85 | 84/82 | 84/83 |
| Lincoln (winter/summer score)1 | 64/66 | 66/64 | 66/71 | 71/62 | 61/64 | 68/67 |
| Industry (winter/summer score) | 70/72 | 73/72 | 70/74 | 75/78 | 80/81 | 82/81 |
Notes to Data
- Ford stopped production of Mercury with the 2011 model year. Beginning in 2011, the dealer satisfaction data for Lincoln dealers no longer include Mercury dealers.
Overall dealer attitude is measured by the National Automobile Dealer Association (NADA) Dealer Attitude Survey. Scores are for the summer and winter respectively of the year noted.
Analysis
Approximately 64 percent of our dealers provided feedback through the summer 2012 NADA survey process. We remained consistent in many areas in this survey compared to our Winter 2011 record improvements, including in our Regional Sales, Service and Parts Personnel rankings. However, scores continued to increase in the categories of Ford Motor Credit Company Capability, Senior Management Effectiveness, Dealer Communications, and Marketing and Vehicle Incentives.
C. Employment by Business Unit
Average number of people employed
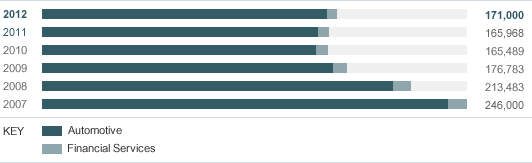
| 2007 | 2008 | 2009 | 2010 | 2011 | 2012 | |
|---|---|---|---|---|---|---|
| Total | 246,000 | 213,483 | 176,783 | 165,489 | 165,968 | 171,000 |
| Automotive | 235,000 | 203,316 | 168,610 | 158,470 | 159,540 | 165,000 |
| Financial Services | 11,000 | 10,167 | 8,173 | 7,019 | 6,428 | 6,000 |
- Reported to regulatory authorities
Notes to Data
These employee numbers do not include dealer personnel; 2009 employee numbers have been adjusted to reflect the new accounting standard on the deconsolidation of many of our variable interest entities.
D. U.S. Employment of Minority-group Personnel and Women at Year-end
Percent
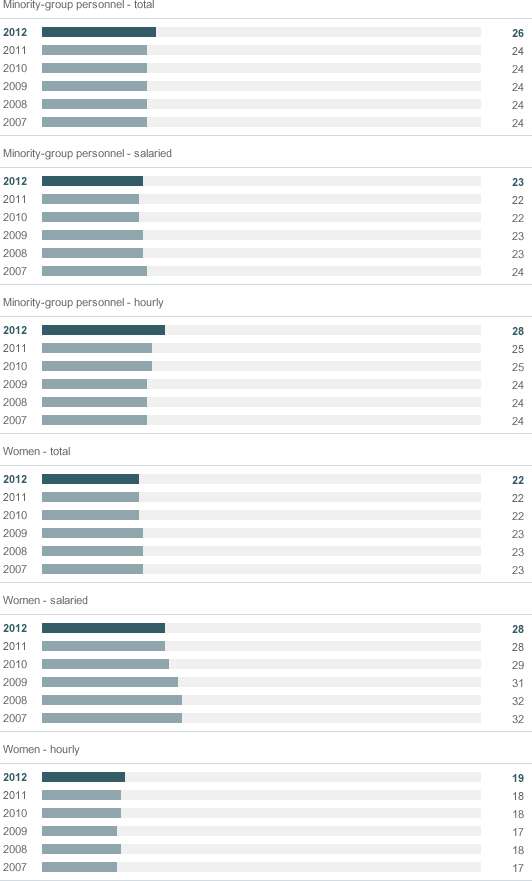
| 2007 | 2008 | 2009 | 2010 | 2011 | 2012 | |
|---|---|---|---|---|---|---|
| Minority-group personnel – total | 24 | 24 | 24 | 24 | 24 | 26 |
| Minority-group personnel – salaried | 24 | 23 | 23 | 22 | 22 | 23 |
| Minority-group personnel – hourly | 24 | 24 | 24 | 25 | 25 | 28 |
| Women – total | 23 | 23 | 23 | 22 | 22 | 22 |
| Women – salaried | 32 | 32 | 31 | 29 | 28 | 28 |
| Women – hourly | 17 | 18 | 17 | 18 | 18 | 19 |
- Reported to regulatory authorities
Notes to Data
To align with the 2003–2007 reported data, 2008 data has been modified to reflect the total Company. Previously, 2008 data reported Ford Automotive data only.
E. Charitable Contributions
$ million
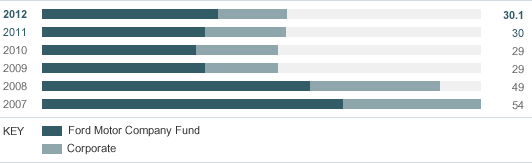
| 2007 | 2008 | 2009 | 2010 | 2011 | 2012 | |
|---|---|---|---|---|---|---|
| Total | 54 | 49 | 29 | 29 | 30 | 30.1 |
| Ford Motor Company Fund | 37 | 33 | 20 | 19 | 20 | 21.6 |
| Corporate | 17 | 16 | 9 | 10 | 10 | 8.5 |
F. Volunteer Corps
Thousand volunteer hours
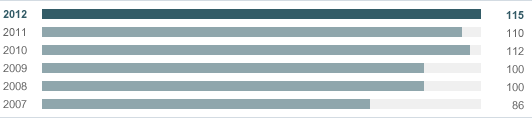
| 2007 | 2008 | 2009 | 2010 | 2011 | 2012 |
|---|---|---|---|---|---|
| 86 | 100 | 100 | 112 | 110 | 115 |
- Year in Review
-
Our Blueprint for Sustainability
Our Blueprint for Sustainability
-
Financial Health
Financial Health
-
Climate Change and the Environment
Climate Change and the Environment
- Water
-
Vehicle Safety and Driver Assist Technologies
Vehicle Safety and Driver Assist Technologies
- Supply Chain
- People
-
Ford Around the World
Ford Around the World


Our Sustainability Data
Downloads
Ford’s 2012/13 Sustainability Report is summarized in this 8-page downloadable document.
- Download now (2.64Mb)
Visit our Downloads page for this report in full or as separate sections along with supplementary publications.