Data: Product, Quality and Service
Data on this page
A. GQRS “Things Gone Wrong” (TGW) (3 months in service)
Total “things gone wrong” per 1,000 vehicles

| 2007 | 2008 | 2009 | 2010 | 2011 | 2012 |
|---|---|---|---|---|---|
| 1,405 | 1,287 | 1,206 | 1,140 | 1,447 | 1,373 |
- Third party rating
Notes to Data
Lower numbers show improvement. For the 2011 model year, we changed the GQRS survey to include additional questions on vehicle entertainment and information systems. Therefore, 2011 results are not comparable to previous years. The Global Quality Research System (GQRS) is a Ford-sponsored competitive research survey. The GQRS is a good indicator of other quality results.
B. GQRS Customer Satisfaction (3 months in service)
Percent satisfied

| 2007 | 2008 | 2009 | 2010 | 2011 | 2012 |
|---|---|---|---|---|---|
| 76 | 77 | 80 | 82 | 68 | 72 |
- Third party rating
Notes to Data
The Global Quality Research System (GQRS) is a Ford-sponsored competitive research survey. The GQRS is a good indicator of other quality results.
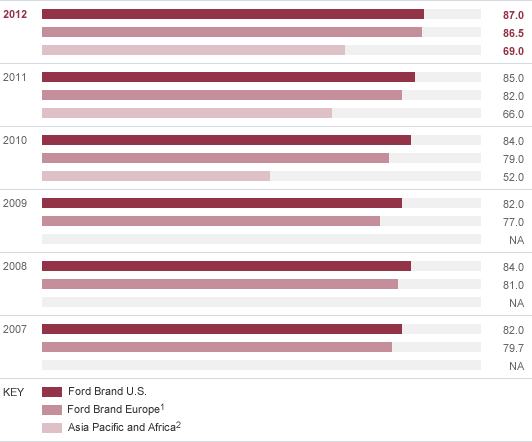
C. Sales Satisfaction with Dealer/Retailer
Net promoter score

Notes to Data
- European sales and service satisfaction with dealers and retailers are based on 23 European markets including Austria, Belgium, Czech Republic, Denmark, Finland, France, Germany, Greece, Hungary, Iceland, Ireland, Italy, Netherlands, Norway, Poland, Portugal, Romania, Russian Federation, Slovenia, Spain, Sweden, Switzerland, Turkey, and the United Kingdom. In past years, the data was mis-labeled as reflecting only UK, Germany, Italy, France, and Spain.
- We initiated the sales satisfaction with dealer/retailer in our Asia Pacific and Africa region in 2010.
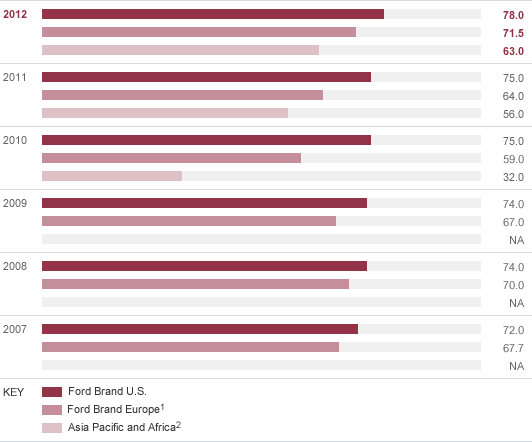
D. Service Satisfaction with Dealer/Retailer
Net promoter score

Notes to Data
Prior to 2008, only warranty repair visits were measured. Starting in 2009, customer-paid repair and maintenance visits are also included. These additions have had a small negative impact on the 2009 score.
- European sales and service satisfaction with dealers and retailers are based on 23 European markets including Austria, Belgium, Czech Republic, Denmark, Finland, France, Germany, Greece, Hungary, Iceland, Ireland, Italy, Netherlands, Norway, Poland, Portugal, Romania, Russian Federation, Slovenia, Spain, Sweden, Switzerland, Turkey, and the United Kingdom. In past years, the data was mis-labeled as reflecting only UK, Germany, Italy, France, and Spain.
- We initiated the service satisfaction with dealer/retailer in our Asia Pacific and Africa region in 2010.


