![]()
Sustainability 2012/13
Data: Financial
Data on this page
A. Cumulative Shareholder Return
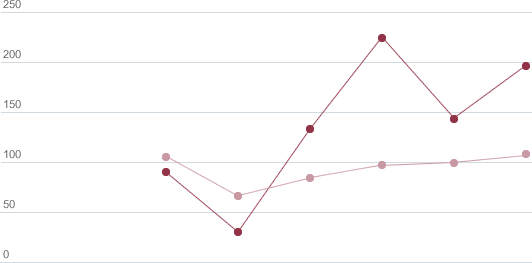
| Base 2007 | 2008 | 2009 | 2010 | 2011 | 2012 | |
|---|---|---|---|---|---|---|
| S&P 500 | 105 | 66 | 84 | 97 | 99 | 109 |
| Ford | 90 | 30 | 133 | 224 | 143 | 196 |
- Provided by third party: Bowne & Co., Inc.
Notes to Data
Updated data to reflect 2007 base.
Analysis
For more information, please see Ford’s Annual Report.
B. Selected Financial Performance Indicators
| 2007 | 2008 | 2009 | 2010 | 2011 | 2012 | |
|---|---|---|---|---|---|---|
| Sales and revenue ($ billion)† | 172.5 | 146.3 | 116.3 | 129 | 136 | 134.3 |
| Income/(loss) from continuing operations ($ billion)† | (2.8) | (14.7) | 2.7 | 6.6 | 20.2 | 5.7 |
| Net income/(loss) ($ billion)† | (2.7) | (14.7) | 2.7 | 6.6 | 20.2 | 5.7 |
| Stock price range (per share) ($) | 6.65–9.7 | 1.01–8.79 | 1.50–10.37 | 9.75–17.42 | 9.05–18.97 | 8.82–13.08 |
| Diluted per share amount of income/(loss) from continuing operations ($)† | (1.4) | (6.46) | 0.86 | 1.66 | 4.94 | 1.42 |
| Diluted per share amount of net income/(loss) ($) | (1.38) | (6.46) | 0.86 | 1.66 | 4.94 | 1.42 |
| Cash dividends per share ($)† | 0 | 0 | 0 | 0 | 0.05 | 0.15 |
| Automotive gross cash ($ billion)1 | 34.6 | 13.4 | 24.9 | 20.5 | 22.9 | 24.3 |
| Shareholder return (percent)‡ | (10.4) | (66) | 337 | 67.9 | (36) | 23 |
- † Audited for disclosure in the Ford Annual Report on Form 10-K
- ‡ Provided by third party: Bowne & Co., Inc.
Notes to Data
- Automotive gross cash includes cash and cash equivalents, net marketable and loaned securities and assets contained in a short-term Voluntary Employee Beneficiary Association (VEBA) trust.
Analysis
For more information, please see Ford’s 10-K and 8-K and Annual Report.
C. Profile of Ford Investors
Percent
| 2007 | 2008 | 2009 | 2010 | 2011 | 2012 | |
|---|---|---|---|---|---|---|
| Institutional Investors: | 69 | 57 | 47 | 57 | 48 | 51 |
| Top 15 | 38 | 33 | 28 | 29 | 23 | 25 |
| Others | 31 | 24 | 19 | 28 | 25 | 26 |
| Employees and Management | 13 | 12 | 9 | 7 | 7 | 7 |
| Individuals1 | 18 | 31 | 44 | 36 | 45 | 42 |
- Provided by third party
Notes to Data
- The ownership by individuals includes shares owned by the Ford family and by Ford employees and management outside of the Company savings plans.
Analysis
For more information, please see Ford’s Annual Report.
D. Worldwide Taxes Paid
$ million
| 2007 | 2008 | 2009 | 2010 | 2011 | 2012 | |
|---|---|---|---|---|---|---|
| Total | 5,719 | 4,796 | 2,988 | 2,930 | 3,279 | 3,221 |
| U.S. (Federal, State and Local) | 1,299 | 780 | 674 | 617 | 567 | 713 |
| Non U.S. | 4,420 | 4,016 | 2,314 | 2,313 | 2,712 | 2,508 |
Analysis
For more information, please see Ford’s 10-K and 8-K and Annual Report.
- Year in Review
-
Our Blueprint for Sustainability
Our Blueprint for Sustainability
-
Financial Health
Financial Health
-
Climate Change and the Environment
Climate Change and the Environment
- Water
-
Vehicle Safety and Driver Assist Technologies
Vehicle Safety and Driver Assist Technologies
- Supply Chain
- People
-
Ford Around the World
Ford Around the World


Our Sustainability Data
Downloads
Ford’s 2012/13 Sustainability Report is summarized in this 8-page downloadable document.
- Download now (2.64Mb)
Visit our Downloads page for this report in full or as separate sections along with supplementary publications.