Data: Fuel Economy and CO2 Emissions
Data on this page
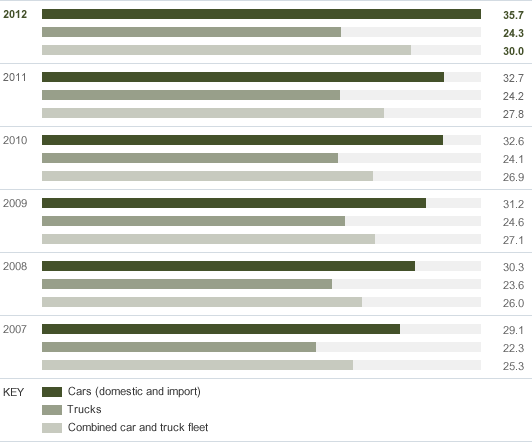
A. Ford U.S. Corporate Average Fuel Economy
Miles per gallon

| 2007 | 2008 | 2009 | 2010 | 2011 | 2012 | |
|---|---|---|---|---|---|---|
| Cars (domestic and import) | 29.1 | 30.3 | 31.2 | 32.6 | 32.7 | 35.7 |
| Trucks | 22.3 | 23.6 | 24.6 | 24.1 | 24.2 | 24.3 |
| Combined car and truck fleet | 25.3 | 26.0 | 27.1 | 26.9 | 27.8 | 30.0 |
B. Ford U.S. CO2 Tailpipe Emissions per Vehicle (Combined Car and Truck Fleet Average CO2 Emissions)
Grams per mile

| 2007 | 2008 | 2009 | 2010 | 2011 | 2012 |
|---|---|---|---|---|---|
| 352 | 340 | 326 | 329 | 318 | 297 |
Notes to Data
Improvement is reflected in decreasing grams per mile. This is the first year that the CO2 data has come directly from Ford’s official Greenhouse Gas report. Under the One National Program regulation, 2012 MY is the first year where a separate greenhouse gas compliance report is required, in addition to the annual CAFE report. The CO2 value includes FFV credits, but does not include credits/debits for air conditioning or off-cycle technologies or CH4/N2O compliance.
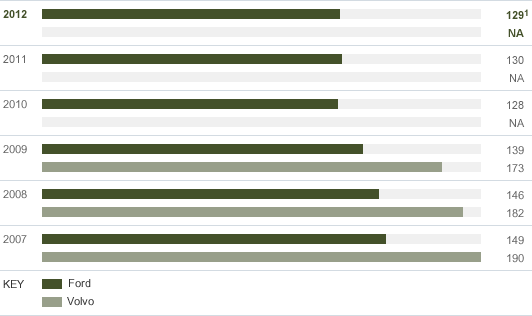
C. Ford Europe CO2 Tailpipe Emissions per Vehicle
Grams per kilometer

| 2007 | 2008 | 2009 | 2010 | 2011 | 2012 | |
|---|---|---|---|---|---|---|
| Ford | 149 | 146 | 139 | 128 | 130 | 1291 |
| Volvo | 190 | 182 | 173 | NA | NA | NA |
Notes to Data
- This is preliminary data; official data from European Commission expected in November 2013.
Improvement is reflected in decreasing grams per kilometer. Based on production data for European markets. European and U.S. fleet CO2 emissions are not directly comparable because they are calculated in different units and because they are assessed based on different drive cycles. In 2009, we switched from reporting European vehicle CO2 emissions as a percent of a 1995 base to reporting actual fleet average CO2 emissions, to parallel our reporting for other regions.


