![]()
Sustainability 2012/13
The Issue
Climate change is the result of an increase in heat-trapping (greenhouse) gases in the atmosphere. Carbon dioxide (CO2) is the major long-lived greenhouse gas (GHG). The burning of fossil fuels (to provide electricity, heat and transportation, and to support industry and agriculture), as well as deforestation, leads to net emissions of CO2 and increased levels of atmospheric CO2. The atmospheric concentration of CO2 has increased from a preindustrial level of 270–280 parts per million (ppm) to a level of approximately 394 ppm at the beginning of 2013 (see Figure 1).
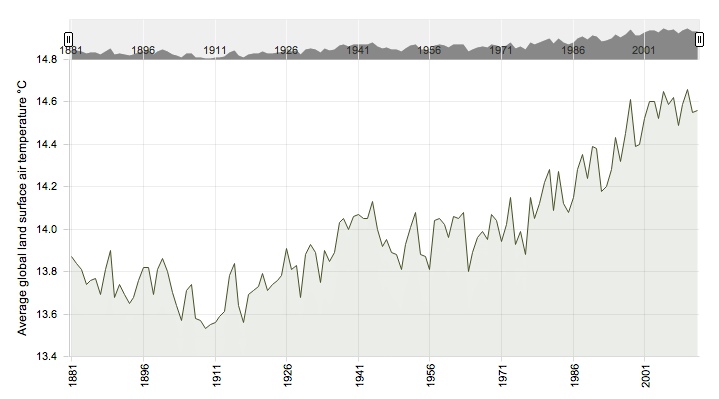
Global temperature records have been reported independently by scientists at the National Aeronautics and Space Administration in the U.S., the National Oceanic and Atmospheric Administration in the U.S., the Climate Research Unit at the University of East Anglia in the U.K., and the Japanese Meteorological Agency. The records from these four independent groups are in good agreement and show a distinct warming trend over the past century. The past decade was the warmest decade in the instrumental temperature record. As shown in Figure 2, the warming trend is continuing, and 2012 was among the warmest years on record. Independent measurements of rising sea levels, increasing acidification of the oceans, loss of Arctic sea ice and the retreat of glaciers around the world are consistent with the impact of rising GHG concentrations and global temperature.
Figure 1: CO2 concentration measured at the observatory in Mauna Loa, Hawaii
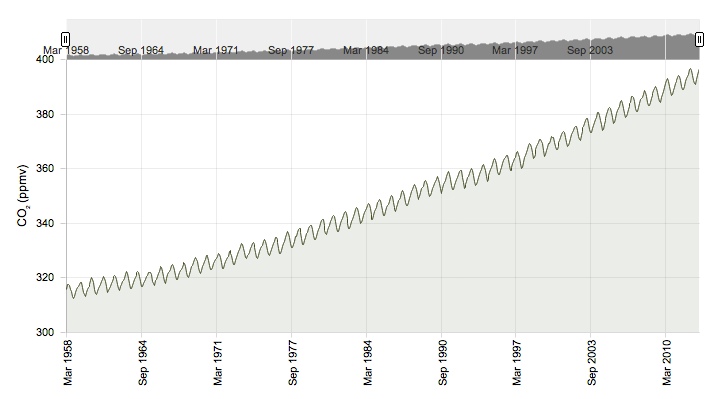
Figure 2: Global temperature
Global Emissions
Figure 3 (below) provides a breakdown of estimated 2009 fossil fuel CO2 emissions by region. For the U.S. and Europe, the emissions are further broken down by sector and by mode in the transportation sector. The data were taken from reports published by the International Energy Agency, the European Environment Agency and the U.S. Environmental Protection Agency. Globally, emissions from cars and light-duty trucks comprise about 11 percent of all fossil fuel CO2 emissions. In the U.S., cars and light-duty trucks account for approximately 20 percent of fossil fuel CO2 emissions, or about 4 percent of global fossil fuel CO2 emissions. In Europe, passenger cars and light-duty trucks account for approximately 19 percent of fossil fuel CO2 emissions, or about 3 percent of global fossil fuel CO2 emissions.
Until approximately 2007, the U.S. was the largest CO2 emitter. Due to economic development, however, emissions from China surpassed those from the U.S. about six years ago, and it is expected that the gap between emissions from China and those from the U.S. will continue to widen in the future. That said, per-capita emissions of CO2 in the U.S. are expected to remain higher (currently by approximately a factor of three) than those in China.
Figure 3: Regional distribution of fossil fuel CO2 emissions in 2010

Global CO2 Emissions
Percent
| 2010 | |
|---|---|
| USA | 17.7 |
| Europe | 12.4 |
| Other North America | 3.1 |
| Central and South America | 4.0 |
| Eurasia | 7.6 |
| Middle East | 5.6 |
| Africa | 3.6 |
| China | 26.2 |
| India | 5.3 |
| Japan | 3.7 |
| Other Asia & Oceania | 9.4 |
| Other Europe | 1.5 |
USA by Sector
Percent
| 2010 | |
|---|---|
| Transportation | 32.4 |
| US Territories | 0.8 |
| Industrial | 14.4 |
| Residential | 6.3 |
| Commercial | 4.2 |
| Electricity Generation | 41.9 |
Europe (EU27) by Sector
Percent
| 2010 | |
|---|---|
| Transportation | 25.3 |
| Manufacturing | 15.9 |
| Residential | 12.7 |
| Commercial | 4.9 |
| Electricity Generation | 38.9 |
| Other | 2.3 |
USA Transportation
Percent
| 2010 | |
|---|---|
| Passenger Cars | 43.1 |
| Light-Duty Trucks | 18.0 |
| Other Trucks | 22.1 |
| Buses | 0.9 |
| Aircraft | 8.1 |
| Ships | 2.4 |
| Rail | 2.5 |
| Other | 3.0 |
Europe (EU27) Transportation
Percent
| 2010 | |
|---|---|
| Passenger Cars | 67.4 |
| Light-Duty Vehicles | 6.48 |
| Heavy-Duty Vehicles | 16.0 |
| Buses | 3.3 |
| Civil Aviation | 1.9 |
| Navigation | 2.1 |
| Railways | 0.8 |
| Other | 2.1 |
USA Passenger Cars
Percent
| 2010 | |
|---|---|
| Vehicle Stocks | 95.7 |
| New Cars | 4.3 |
Europe (EU27) Passenger Cars
Percent
| 2010 | |
|---|---|
| Vehicle Stocks | 94.4 |
| New Cars | 5.6 |
- Year in Review
-
Our Blueprint for Sustainability
Our Blueprint for Sustainability
-
Financial Health
Financial Health
-
Climate Change and the Environment
Climate Change and the Environment
- Water
-
Vehicle Safety and Driver Assist Technologies
Vehicle Safety and Driver Assist Technologies
- Supply Chain
- People
-
Ford Around the World
Ford Around the World


Our Sustainability Data
Downloads
Ford’s 2012/13 Sustainability Report is summarized in this 8-page downloadable document.
- Download now (2.64Mb)
Visit our Downloads page for this report in full or as separate sections along with supplementary publications.