Toolbox
Water Use
Data On This Page
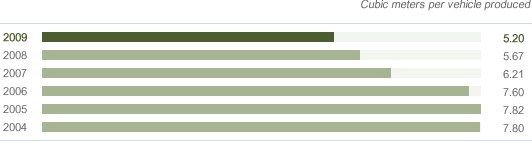
A. Global Water Use Per Vehicle Produced
| 2004 | 2005 | 2006 | 2007 | 2008 | 2009 |
|---|---|---|---|---|---|
| 7.94 | 7.82 | 7.76 | 6.21 | 5.67 | 5.20 |
The reduction in water use from 2008 to 2009 reflects a long-term trend of reducing water use per vehicle each year. Ford facilities have achieved reductions in water consumption through a broad range of actions.
- Data managed through the Global Emissions Manager database
In This Report:
B. Global Water Use By Source

| 2004 | 2005 | 2006 | 2007 | 2008 | 2009 | |
|---|---|---|---|---|---|---|
| City water (includes surface and well water) | 27.5 | 26.2 | 24.8 | 24.8 | 22.0 | 18.0 |
| Surface water | 16.2 | 15.9 | 16.1 | 8.6 | 2.7 | 2.0 |
| Well water | 6.4 | 5.6 | 6.1 | 4.4 | 4.2 | 4.1 |
From 2008 to 2009, we reduced our overall water use (from all sources) by 16.6 percent. This reduction exceeds our overall target of a 6 percent reduction in water use each year and reflects a long-term trend of reducing water use from all sources. Ford facilities have achieved reductions in water consumption through a broad range of actions.
- Data managed through the Global Emissions Manager database
In This Report:
C. Regional Water Use
Premier Automotive Group is now included in Europe

Premier Automotive Group is now included in Europe
| 2004 | 2005 | 2006 | 2007 | 2008 | 2009 | |
|---|---|---|---|---|---|---|
| Asia Pacific and Africa | 2.4 | 3.0 | 3.0 | 4.0 | 4.0 | 3.9 |
| Europe | 8.3 | 7.4 | 7.5 | 6.7 | 5.9 | 5.0 |
| North America | 36.1 | 34.7 | 32.9 | 24.1 | 15.8 | 12.8 |
| South America | 2.4 | 2.6 | 2.5 | 2.4 | 2.5 | 2.4 |
2008 Asia Pacific and Africa data changed from our last report due to improved data collection.
This year, we reduced water use in all regions. We have a long-term trend of reducing water use in North America and Europe.
In Asia Pacific and Africa, water use has been increasing over the past few years, due largely to the increase in vehicles produced in this region. From 2008 to 2009, however, we reduced water usage in this region for the first time since 2003.
In South America, water use has remained largely constant since 2003.
- Data managed through the Global Emissions Manager database